
Summary
Underwater photogrammetry builds measurable 3D models from overlapping images of submerged sites. In practice, the workflow is capture plus refraction-aware calibration, then SfM alignment and bundle adjustment, then dense reconstruction, mesh and texture generation, and finally scaling, georeferencing where needed, and validation against reference measurements. [S01] [S07]
What Underwater Photogrammetry Is (and Isn’t)
Underwater photogrammetry is image-based 3D reconstruction, not a magic scanner. NOAA defines photogrammetry as approximating three-dimensional structure from two-dimensional images, and in underwater work it is used to create outputs such as 3D models and photomosaics for archaeological sites and coral reefs. The geometry comes from overlap, feature matching, and reconstruction, not from a device directly measuring every point in one pass. [S01]
Active sensing projects or measures light patterns to infer shape, while passive sensing uses recorded imagery only. In underwater literature, that distinction separates optical scanners from photogrammetry-based methods such as stereo vision and structure from motion, so underwater 3D scanning and underwater photogrammetry are related but not interchangeable categories. [S05]
Historical Background: From Sketches and Photo Mosaics to SfM
Early underwater documentation depended on sketches, diver notes, and photo mosaics that were often assembled manually. A deep-ocean mapping review points to early deep-sea mosaicing examples such as the Thresher and Titanic surveys, and notes that researchers physically pieced photographs together before modern digital processing was available. That workflow provided visual context, but it did not automatically produce a metrically structured 3D model. [S04]
Modern underwater photogrammetry shifted that practice from stitched views toward computational 3D mapping. NOAA now frames underwater archaeological sites and coral reefs as routine photogrammetry targets, with image capture by divers or ROVs from hundreds or thousands of overlapping stills, or from video after still frames are extracted. NOAA’s coral-reef SfM standard operating procedure runs to 91 pages, which underscores that repeatable subsea photogrammetry is a survey workflow, not a one-click process. [S01] [S02]
How Underwater Photogrammetry Works (SfM → MVS)
The process starts with overlap. Software detects repeatable features across multiple views, matches them, estimates camera poses, and triangulates those matches into a sparse set of points. That sparse network is the backbone of underwater structure from motion, because weak overlap or weak texture means weak geometry.
After alignment, bundle adjustment refines camera pose and calibration parameters jointly so the full image network fits as consistently as possible. Agisoft’s manual describes this stage in terms of aerotriangulation with bundle block adjustment, followed by dense depth maps generated from oriented images through dense stereo matching. In software-agnostic terms, the pipeline is sparse tie points, camera optimization, dense point cloud, mesh, and then texture. [S07]
Underwater conditions make that familiar pipeline harder to satisfy. Water and air have different refractive indices, about 1.33 for water and 1.00 for air in the hydrography review, so light rays bend at interfaces instead of following the simpler geometry assumed by ordinary in-air reconstruction. Underwater calibration literature also warns that refraction can violate the single-viewpoint assumption, while passive methods depend heavily on scene texture. In practice, turbidity, backscatter, attenuation, and low-contrast surfaces can break feature matching before dense reconstruction begins. [S03] [S05]
Refraction, Ports, and Calibration
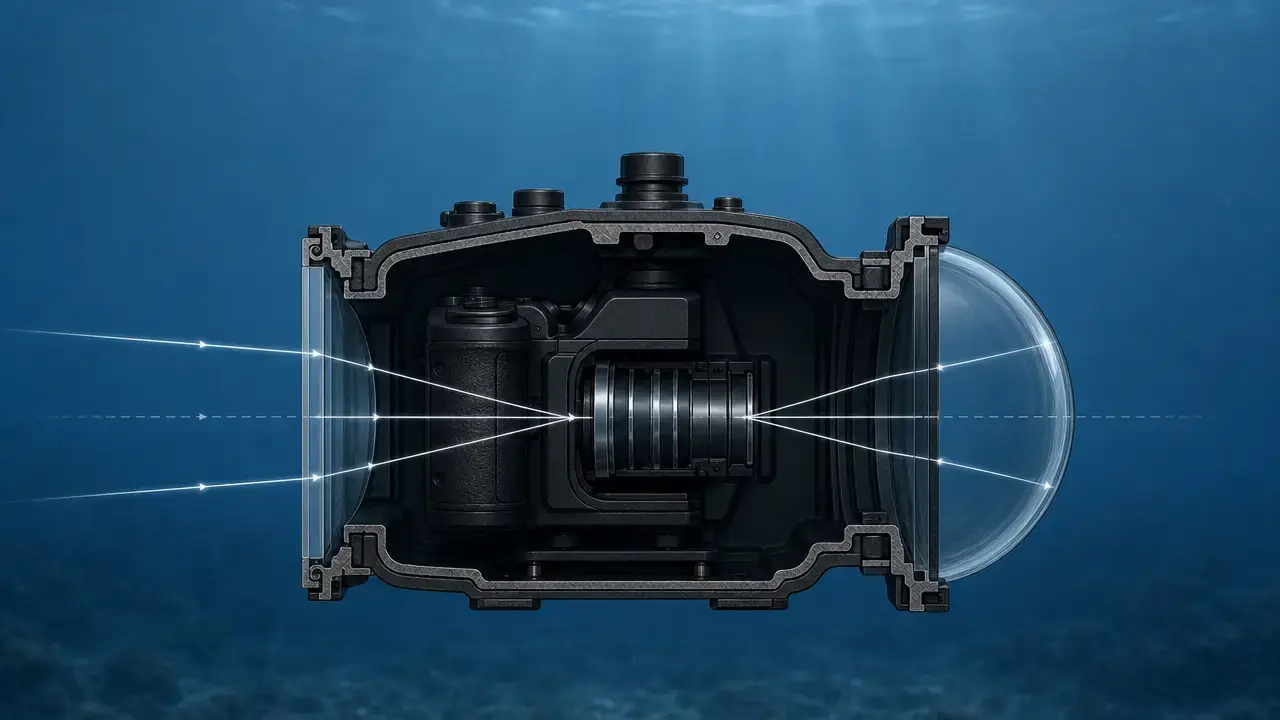
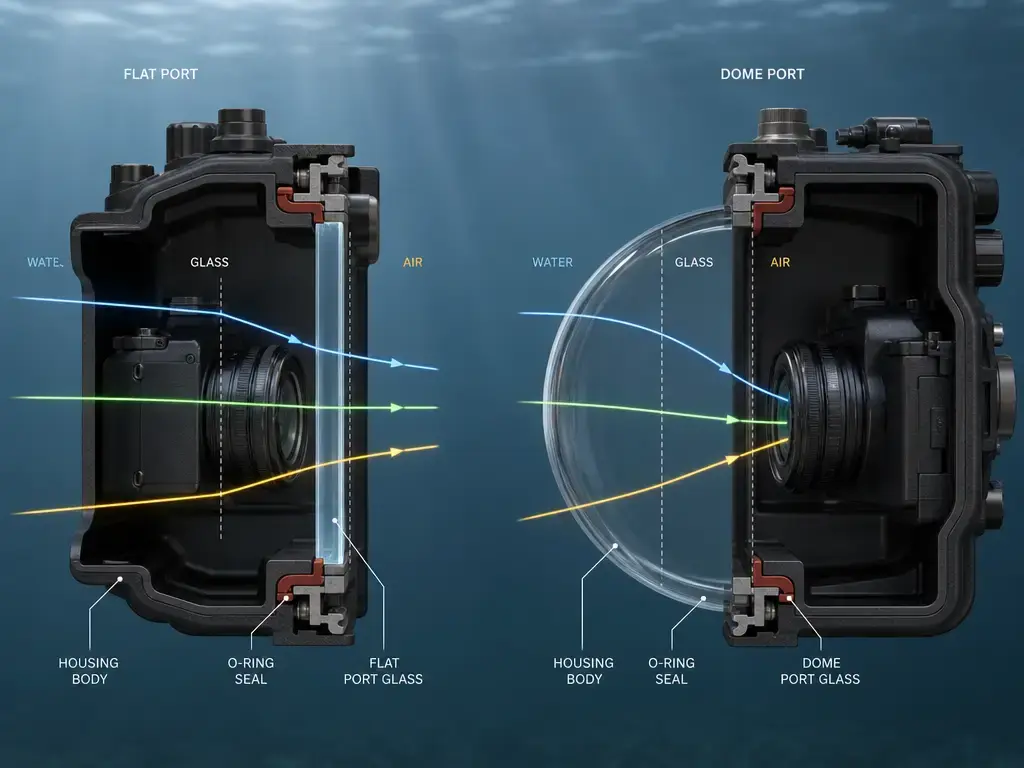
Refraction is the main reason underwater photogrammetry cannot be treated as ordinary photogrammetry with a wet camera. The hydrography review gives refractive indices of about 1.33 for water and 1.00 for air, and also notes the corresponding propagation-speed contrast, with light traveling at about 300,000 km/s in air and about 225,564 km/s in water. Once rays cross water, housing glass, and air, they bend, so the image geometry no longer matches a simple in-air pinhole model cleanly. [S03]
Port geometry changes how severe that mismatch becomes. A dome port can reduce some refractive effects, but it does not universally eliminate them. The same review states that theoretical “no refraction” at a hemispherical dome requires the projection center to sit exactly at the dome center and the rays to remain radial, conditions that are not automatically met in real camera-and-housing setups. Menna et al. also report that, in their tested configuration, the flat port performed worse than the hemispherical dome, with higher image residuals and lower precision and accuracy in object space. [S03] [S06]
Calibration therefore has to be realistic about optics. Refraction can make an underwater camera system non-central, especially with flat ports, so the assumption of a single projection center may fail. Castillón et al. note that some refractive effects can be partially absorbed into radial distortion terms, but systematic errors can remain because the single-viewpoint model does not strictly hold; one rigorous alternative is ray tracing through the refractive interfaces. Calibration strategy depends on port geometry and workflow, so it is not safe to assume software fixes refraction automatically. In one review context under relatively favorable conditions, diffusion and refraction were associated with about a factor-two accuracy degradation, but that is a bounded example, not a universal multiplier. Pressure adds another practical constraint, because deep water increases pressure by about 1 atmosphere per 10 m. [S05] [S03] [S04]
Underwater Structure-from-Motion Workflow
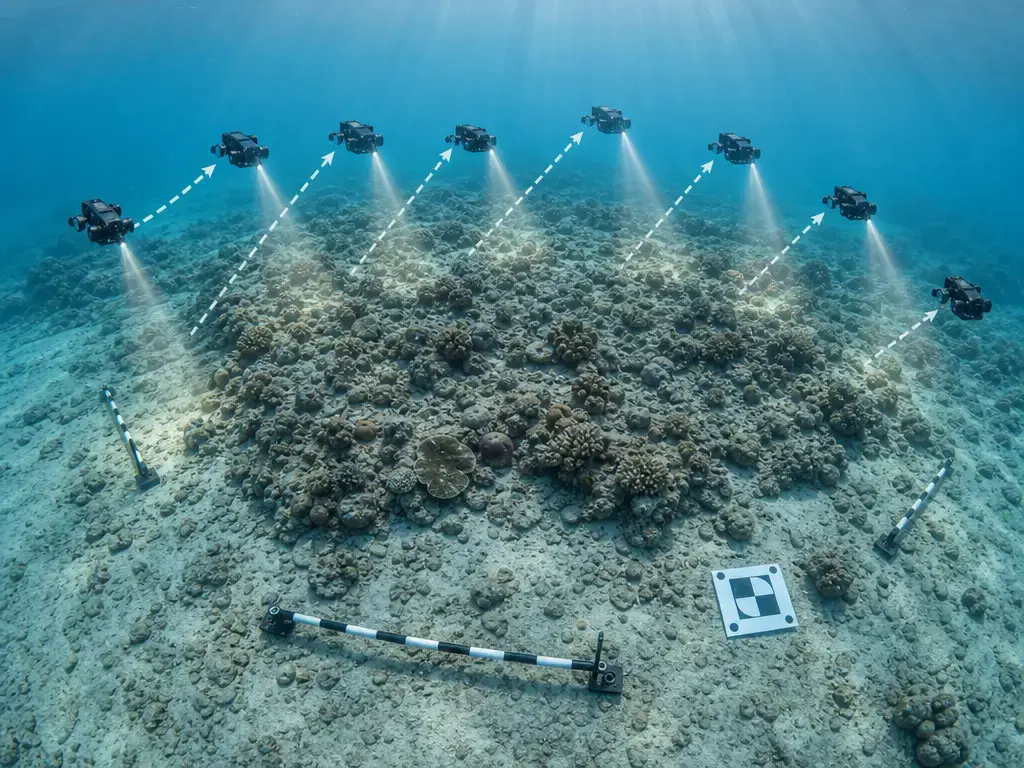
A practical underwater structure-from-motion workflow is a repeatable survey process, whether the platform is a diver, ROV, or AUV. NOAA’s coral-reef SOP is useful here because it treats image collection, scale control, quality control, and processing as one connected procedure. In one NOAA coral-program setup, maintaining about 1 m standoff with a 24 MP Canon SL2/3, an 18 mm lens, and a 6-inch dome port produced an image footprint of about 1.03 m × 0.69 m, while 60% side overlap and 80% forward overlap were used to keep the image network connected. [S02]
Workflow discipline matters more than any single software package. The broad logic is the same across tools: align first, optimize the camera network, then densify, mesh, texture, scale, and check the result. Generic above-water guidance such as Autodesk ReCap’s “at least 3 perspectives,” at least 60% overlap, at least 20% orthogonal overlap, and the warning that over 80% can become redundant is a useful baseline, but underwater work is usually less forgiving because optics and visibility reduce margin for error. Project-dependent manufacturer examples, such as Agisoft help ranges of 20,000 to 100,000 key points, 2,000 to 40,000 tie points, and 4096 to 16,384 px texture atlases, are best treated as examples rather than rules. [S07] [S08] [S09]
- Plan target area, depth, lighting, and scale control.
- Choose camera, housing, port, and lens.
- Capture overlapping still images or selected video frames.
- Apply image QC and project-dependent preprocessing (separate geometry vs appearance).
- Align photos and estimate camera poses.
- Generate sparse/tie points and dense point cloud.
- Build mesh and texture.
- Scale, orient, and validate with scale bars/check distances.
- Export point cloud, mesh, orthomosaic, DEM, or CAD-ready references.
Preprocessing Underwater Images: What Helps Geometry vs What Helps Looks
Underwater image preprocessing is not one thing. Geometry-oriented steps are whatever helps stable feature detection, matching, and camera solving stay consistent across the dataset. Appearance-oriented steps are whatever makes the output easier for a person to interpret, such as color restoration, contrast enhancement, or dehazing. Agrafiotis et al. frame the issue explicitly by testing whether color correction and enhancement should be applied before SfM-MVS or only to the final orthoimage when the visual deliverable matters most. [S16]
The practical lesson is caution, not prohibition. Enhancement may help in turbid water or strong backscatter, but it may also change feature-matching behavior and therefore alter reconstruction outcomes. A conservative workflow keeps edits consistent across the project, avoids aggressive per-image local corrections, and treats strong radiometric changes as a tested choice rather than a default. Vendor advice can still be useful as field guidance, but it is not the same as independent validation. [S16] [S15]
Scale, Control, and Georeferencing Underwater
Scaling and orientation start locally. Scale bars give the solver a known distance, which is what turns an image-derived model into a measurable object. NOAA’s coral SOP shows a coded-marker scale bar with end-marker centers about 0.25 m apart, and vendor guidance recommends using bars as long as practical, placing them perpendicularly where possible, and using extra bars as verification checks. [S02] [S15]
Local scale is not the same as global position. A model can be locally accurate after scaling yet globally mispositioned, because satellite navigation is unavailable below the surface and deep-ocean visual mapping is performed in a navigation-denied environment. That is why a visually convincing or well-scaled mesh can still sit in the wrong map location. [S04]
The route to georeferencing depends on the platform. One underwater-drone archaeology workflow oriented the full dataset after final bundle adjustment and then georeferenced it with the drone’s navigation data. By contrast, the shallow-water POSEIDON system uses direct RTK-based SfM, assigning per-image positions described as accurate to a few centimetres. Both approaches can work, but both still require validation because navigation error, timing error, and optical assumptions can propagate into the final georeference. [S17] [S18]
The table below separates common control strategies by what they actually provide. [S02] [S04] [S17] [S18]
| Approach | What it gives you | Typical inputs | Common failure mode |
|---|---|---|---|
| Scale bars only | Local scale and orientation | Overlapping images, measured bars | Correct size but no reliable world position |
| Surveyed control | Strong local or local-plus-global control | Images, control points, measured infrastructure | Sparse or badly distributed control distorts confidence |
| Surface-referenced control | Link to an external map frame | Surface RTK/GNSS references, synchronized geometry | Timing, lever-arm, or reference mismatches |
| ROV/AUV navigation-integrated | Approximate world position and platform orientation | Images plus USBL/DVL/INS/RTK or related navigation data | Drift or navigation bias propagates into the model |
Performance Metrics — Accuracy vs Precision vs Resolution
Accuracy vs Precision vs Resolution
Accuracy is closeness to a reference, precision is repeatability, and resolution is the smallest separable or representable detail. Those are different questions. A model can look high-resolution and still be inaccurate, or be locally accurate after scaling while being poorly georeferenced globally. [S10] [S11]
Underwater photogrammetry can produce quantitatively useful models, but accuracy is environment-, setup-, and validation-dependent; mm-scale results in papers are illustrative and do not equal certified metrology performance in routine field work. That caution matters more underwater because refraction, turbidity, and calibration uncertainty enter the chain before bundle adjustment even starts. ISO 10360-13:2021 is relevant only as adjacent metrology context for optical 3D coordinate measuring systems, and ASTM 3D imaging standards plus the E57 interchange ecosystem are useful context for standards and point-cloud handling, but none of that certifies an underwater photogrammetry workflow by itself. [S03] [S19] [S20] [S07]
Study-specific numbers are still valuable, as long as the metric and reference are named. In Hatcher et al., the scale-bar check metric, referenced to machined underwater bars ranging from 10 cm to more than 72 cm, showed a mean difference of 0.2 mm with a standard deviation of 0.5 mm, with all checks under 1 mm and a scaled error of 0.016 to 0.024% of water depth in that Florida Keys survey context. In the same study, the repeat-survey difference metric, referenced to surveyed bathymetric surfaces, was about 1 to 4 cm before correction and approached under 1 cm after correction, while a three-point correction produced mean errors within 2 mm and variances of 2 to 4 mm. [S10]
Marre et al. show why one “accuracy number” is misleading. In their study, GCP RMSE, referenced to the control-point set, ranged from 0.1 to 9.0 mm, and 83% of models were under 1 mm for that metric. Their cloud-to-mesh distance, referenced to an in-air rock model, ranged from 0.04 to 9.6 mm with a mean absolute distance of 1.2 mm across replicates. Their relative measurement error was under 1% for most measures, but bucket surface area as the chosen metric had a mean error of 16.11% with a standard deviation of 2.12%. In the same setup, a targeted acquisition density of 4 to 5 photos/m² at 2.5 m height gave the best trade-off between model quality and processing time. [S11]
- Reprojection error: image-space fit, not real-world accuracy by itself.
- GCP/checkpoint RMSE: fit to known or measured control points.
- Scale-bar error: local distance validation.
- Point density / mesh spacing: geometric detail, not accuracy alone.
- Cloud-to-mesh distance: comparison with a reference model.
- Repeat-survey difference: important for monitoring change over time.
- Georeferencing error: separate from local model quality.
The table below separates the most commonly confused metrics. [S10] [S11]
| Metric | What it tests | What it cannot prove | Typical misuse |
|---|---|---|---|
| Reprojection error | How well image observations fit the solved camera model | Real-world dimensional accuracy on its own | Treating sub-pixel fit as proof the mesh is metrically correct |
| GCP RMSE | Agreement with surveyed control points | Uniform accuracy everywhere away from control | Quoting one RMSE value as if it covers the whole model |
| Scale-bar error | Local distance accuracy against known bars | Global georeferencing quality | Assuming good local scale means good map position |
| Cloud-to-mesh distance | Geometric agreement with a reference surface | That every measurement task will be equally accurate | Using one reference comparison to certify every downstream measurement |
| Repeat-survey difference | Stability of change detection between surveys | Absolute truth without an external reference | Confusing consistency with correctness |
| Georeferencing error | Placement in a world coordinate frame | Internal surface quality by itself | Assuming correct coordinates mean correct local geometry |
Types and Taxonomy — Underwater 3D Scanning vs Photogrammetry
Active methods project or measure light patterns, while passive methods rely on recorded imagery only. [S05]
The table below compares the main method families by data source, strengths, and limitations rather than trying to name one universal winner. [S01] [S03] [S05]
| Method | Data source | Strengths | Limitations |
|---|---|---|---|
| Underwater photogrammetry / SfM | Overlapping 2D images | Produces textured 3D models and photomosaics from the same dataset; efficient when the scene has texture, overlap, and manageable optics | Sensitive to turbidity, backscatter, weak texture, and calibration errors |
| Underwater laser line scanning | Active laser profiles | Strong for close-range geometry when natural texture is weak | Typically short-range and still affected by water quality and calibration complexity |
| Structured light underwater scanning | Projected patterns | Useful for dense close-range capture of smaller controlled targets | Short working range and challenging in unstable or turbid water |
| Sonar / acoustic 3D mapping | Acoustic returns | Much longer range and not affected by turbidity in the same way as optics | Lower visual and lateral detail than optical methods |
| Hybrid camera + laser systems | Images plus active optical data | Combine texture with stronger geometric support | Higher system and calibration complexity |
Photogrammetry’s main advantage is that it can turn one overlapping image dataset into both textured geometry and photomosaics. Its main weakness is that it depends on stable optical conditions and enough scene texture for matching. Refraction is part of that limitation: with water at about n ≈ 1.33 and air at about n ≈ 1.00, underwater optical reconstruction is never just an above-water workflow moved below the surface. [S01] [S03]
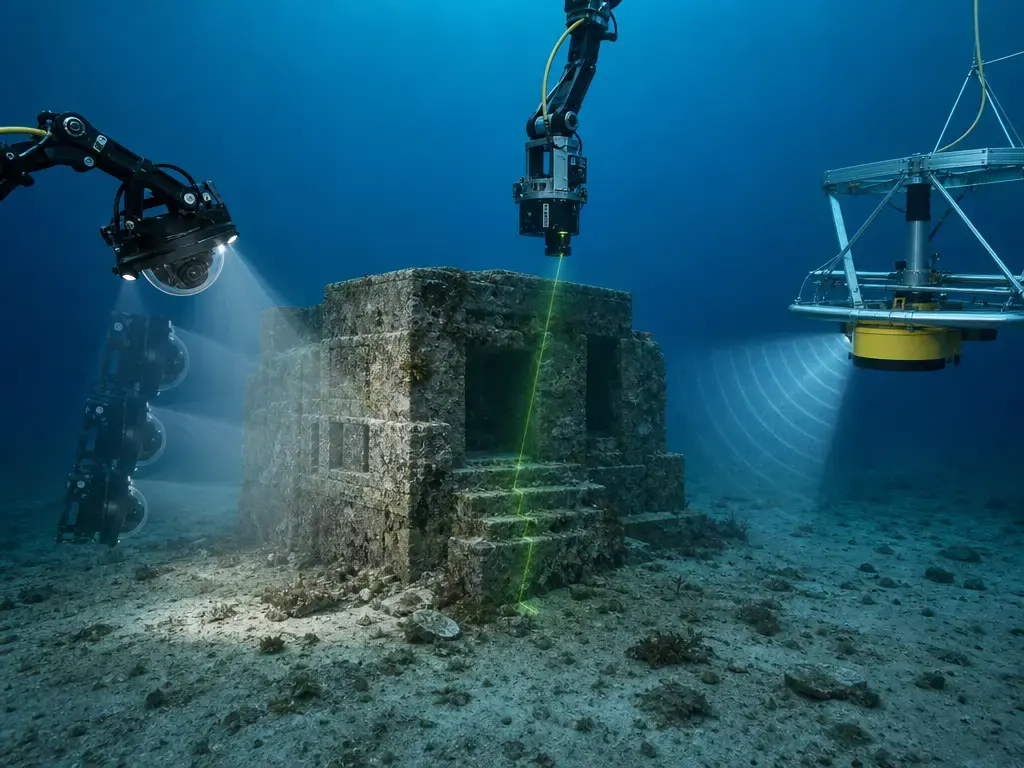
Active optical scanners can be preferable when surface texture is weak or a dense close-range geometric profile is the priority. The same review that defines active versus passive underwater sensing also notes the trade-off: sonars can operate at much longer ranges, up to thousands of meters, and are not affected by turbidity, whereas optical systems offer much higher lateral resolution but are usually short-range, typically a few meters. The same source also highlights calibration difficulty, backscatter sensitivity, and the effect of refraction through viewports. [S05]
Manufacturer specifications help define the boundaries of commercial systems, but they are not independent validation. For example, Voyis lists the Insight Pro at 1.5 to 15 m scan range, 90 Hz profile rate, 2048 points per line, 4000 m or 6000 m depth-rated options, and a 448 nm laser under 75 mW, Class 3B. 2G Robotics lists the ULS-500 Micro at 1.2 to 10 m scan range, 2464 points per line, 89 Hz, and a 1000 m depth rating upgradeable to 4000 m. [S13] [S14]
Applications of Subsea Photogrammetry
Subsea photogrammetry is a good fit when the goal is a textured 3D record that can also be measured. NOAA explicitly points to underwater archaeology and coral reefs, with outputs such as 3D models and photomosaics. In reef work, NOAA’s coral SOP uses a 3 m × 20 m survey-plot example, which reflects the method’s strength on bounded sites where overlap, standoff distance, and repeat imaging can be controlled. [S01] [S02]
The same approach also fits wrecks, submerged infrastructure, and digital-twin-style documentation where both shape and surface appearance matter. The Yuba Island project is a project-specific example, not a field benchmark: it reported coverage across depths from 0.5 to 70 m, a mapping rate of 4.5 m²/s, image resolution of 1 mm/px, and depth accuracy of ±0.10 m relative to local mean sea level. That result helps explain why underwater photogrammetry is attractive for heritage documentation, habitat mapping, inspection, and downstream uses such as analysis or model sharing. [S12]
Limitations and Failure Modes
Most underwater photogrammetry failures are ordinary photogrammetry failures made worse by water. Turbidity and backscatter lower contrast, repeated patterns give weak matches, and passive methods rely heavily on texture. Moving fish, algae, or soft corals can create inconsistent observations, and motion blur from the platform or subject can further thin the tie-point network. Insufficient overlap is another classic failure mode; NOAA’s coral workflow used 60% side overlap and 80% forward overlap precisely to keep the reconstruction network well connected. [S05] [S02]
Refraction adds a separate risk layer because calibration can look acceptable while still carrying systematic bias. Flat ports are especially sensitive to this problem, and even dome ports only reduce it conditionally. That is why housing, port, and calibration assumptions have to be treated as measurement variables, not as accessories. [S03] [S05]
A good-looking textured mesh is not automatically a trustworthy measuring tool. Hatcher et al. show why scale-bar checks and repeat surveys matter, and Marre et al. show why one metric can look strong while another, such as bucket surface area, can still show much larger error in the same general workflow. Every measurement claim needs validation, and the validation method should match the actual question being asked, whether that question is local scale, repeatability, map position, or reference-surface agreement. [S10] [S11]
Current Research and Market Context
Current research keeps returning to three bottlenecks: refractive calibration, radiometric restoration, and localization when underwater platforms do not have direct satellite navigation. Deep-ocean optical mapping remains constrained by poor visibility and the need to stay close to the seafloor, which a recent survey links to mapping speeds on the order of a hectare per hour or less in some conditions. The radiometry literature is still asking when enhancement should happen relative to SfM-MVS, rather than assuming one universal preprocessing order. [S04] [S16]
In practice, the market split is mostly use-case driven. Industrial inspection often benefits from active optical systems or hybrid camera-plus-navigation workflows when natural texture is weak, while archaeology, reef monitoring, and conservation continue to get strong value from camera-based underwater photogrammetry because the textured 3D record is itself a primary deliverable. Optical scanners still face short working ranges and calibration complexity compared with acoustics, while acoustic systems keep their advantage when range matters more than fine visual detail. [S01] [S05]
Key Takeaways for Underwater Photogrammetry Projects
Underwater photogrammetry works best when it is treated as a measurement workflow rather than a photo exercise. Plan overlap intentionally, choose the housing and port as part of the optical system, separate geometry-oriented preprocessing from appearance-oriented enhancement, and validate against independent references instead of trusting a plausible-looking mesh. NOAA’s coral workflow uses 60% side overlap and 80% forward overlap in one field context, while published validation studies show that reported quality depends strongly on which metric is being tested and what it is referenced to. [S02] [S10] [S11]
- Use controlled overlap.
- Keep camera distance consistent.
- Use scale bars or control distances.
- Capture oblique images for relief and overhangs.
- Validate measurements separately from visual quality.
- Report accuracy by metric and source.
FAQ
How does underwater photogrammetry work?
Underwater photogrammetry works by using many overlapping images of the same site or object, matching shared features, solving camera poses with SfM, refining that solution with bundle adjustment, and then densifying the surface into a point cloud, mesh, and texture. NOAA notes that the input can be still photographs or still frames extracted from video. [S01] [S07]
What is subsea photogrammetry used for?
Subsea photogrammetry is used when the goal is a textured, measurable 3D record rather than a simple inspection image. Common applications include coral-reef monitoring, habitat mapping, underwater archaeology, wreck documentation, and some digital-twin-style surveys of submerged assets and environments. [S01] [S02] [S12]
How do you create an underwater 3D model?
Start with a planned capture path, enough overlap, stable standoff distance, and some form of scale control if measurement matters. Then process the images through alignment, camera optimization, dense reconstruction, meshing, texturing, and validation. If the model must sit in a map frame, add control or navigation data instead of assuming scale bars alone will georeference it. [S02] [S07] [S17] [S18]
What is the underwater structure from motion workflow?
The underwater structure from motion workflow is capture planning, overlapping image acquisition, image QC, photo alignment, camera-pose estimation, bundle adjustment, dense reconstruction, mesh and texture generation, then scaling and validation. Underwater-specific complications come from refraction, backscatter, attenuation, and moving subjects, all of which can reduce tie-point quality before the solver does anything clever. [S02] [S05] [S16]
Underwater 3D scanning vs photogrammetry: what is the difference?
Photogrammetry is passive and reconstructs shape from overlapping images. Underwater 3D scanning is usually active and measures projected light or laser structure directly. Photogrammetry often fits best when textured visual documentation is the goal, while active systems can be preferable when surface texture is weak or a dense close-range profile matters more than a color-rich model. [S01] [S05]
How accurate is underwater photogrammetry?
There is no single universal accuracy number. Accuracy depends on the metric, the reference used, the water conditions, the optics, the control network, and the validation method. Published studies report strong results for specific tasks such as scale-bar checks, GCP RMSE, cloud-to-mesh distance, or repeat surveys, but those numbers are not interchangeable and should not be generalized into one headline figure. [S10] [S11]
Do dome ports eliminate refraction?
No, not universally. A dome port can reduce some refractive problems, but the ideal no-refraction condition depends on exact geometry: the projection center would need to be exactly at the dome center and the rays would need to remain radial. Real camera-housing setups do not automatically satisfy that condition, so calibration still matters. [S03] [S06]
Sources
Grouped from official and standards context to peer-reviewed, manufacturer, and vendor sources.
- Official and standards context
- S01 NOAA Ocean Exploration, “Photogrammetry.” https://oceanexplorer.noaa.gov/technology/photogrammetry/
- S02 Torres-Pulliza et al., Processing Coral Reef Imagery Using Structure-from-Motion Photogrammetry: Standard Operating Procedures (2023 Update). https://repository.library.noaa.gov/view/noaa/60890/noaa_60890_DS1.pdf
- S19 ISO, ISO 10360-13:2021 listing. https://www.iso.org/standard/74957.html
- S20 ASTM, 3D imaging standards overview. https://store.astm.org/products-services/standards-and-publications/standards/3d-imaging-standards.html
- Peer-reviewed and review sources
- S03 Mandlburger, “A Review of Active and Passive Optical Methods in Hydrography.” https://ihr.iho.int/articles/a-review-of-active-and-passive-optical-methods-in-hydrography/
- S04 Song et al., “Optical Imaging and Image Restoration Techniques for Deep Ocean Mapping: A Comprehensive Survey.” https://link.springer.com/article/10.1007/s41064-022-00206-y
- S05 Castillón et al., “State of the Art of Underwater Active Optical 3D Scanners.” https://mdpi-res.com/d_attachment/sensors/sensors-19-05161/article_deploy/sensors-19-05161.pdf
- S06 Menna et al., “Flat Versus Hemispherical Dome Ports in Underwater Photogrammetry.” https://isprs-archives.copernicus.org/articles/XLII-2-W3/481/2017/isprs-archives-XLII-2-W3-481-2017.pdf
- S10 Hatcher et al., “Accurate Bathymetric Maps From Underwater Digital Imagery Without Ground Control.” https://www.frontiersin.org/journals/marine-science/articles/10.3389/fmars.2020.00525/full
- S11 Marre et al., “Monitoring Marine Habitats With Photogrammetry: A Cost-Effective, Accurate, Precise and High-Resolution Reconstruction Method.” https://www.frontiersin.org/journals/marine-science/articles/10.3389/fmars.2019.00276/pdf
- S12 Gerigk, “Underwater Digital Twin of Yuba Island: Mapping a Large-Scale Marine Ecosystem through Photogrammetry and 3D Modeling.” https://isprs-archives.copernicus.org/articles/XLVIII-2-W10-2025/87/2025/
- S16 Agrafiotis et al., “The Effect of Underwater Imagery Radiometry on 3D Reconstruction and Orthoimagery.” https://isprs-archives.copernicus.org/articles/XLII-2-W3/25/2017/isprs-archives-XLII-2-W3-25-2017.html
- S17 Diamanti et al., “Underwater Drones as a Low-Cost, yet Powerful Tool for Underwater Archaeological Mapping: Case Studies from the Mediterranean.” https://journal.caa-international.org/articles/10.5334/jcaa.184
- S18 “Low-tech and low-cost system for high-resolution underwater RTK photogrammetry in coastal shallow waters.” https://horizon.documentation.ird.fr/exl-doc/pleins_textes/2024-03/010088954.pdf
- Manufacturer documentation
- S07 Agisoft, Metashape User Manual v2.2. https://www.agisoft.com/pdf/metashape_2_2_en.pdf
- S08 Agisoft Helpdesk, “3D model reconstruction.” https://agisoft.freshdesk.com/support/solutions/articles/31000152092-3d-model-reconstruction
- S09 Autodesk ReCap, “Scene Geometry and Materials.” https://help.autodesk.com/cloudhelp/2018/ENU/Reality-Capture/files/GUID-CC48BA64-0CDA-42C6-AC78-518587672CE3.htm
- S13 Voyis, “Insight Pro Underwater Laser Scanner.” https://voyis.com/insight-pro/
- S14 2G Robotics, ULS-500 Micro datasheet. https://cdn2.hubspot.net/hubfs/4456320/Datasheet%20Downloads/ULS-500-Micro_Datasheet_Digital_A2-1.pdf
- Vendor blog
- S15 Pix4D Blog, “Diving into underwater photogrammetry.” https://www.pix4d.com/blog/diving-into-underwater-photogrammetry