
Summary
3D scanning for quality control and inspection turns physical parts into digital geometry for analysis, but capture alone does not establish conformance. In manufacturing, it sits within a dimensional metrology workflow rather than as a standalone hardware task. [1] [4]
For dimensional inspection, the result depends on how data are captured, aligned, compared to CAD, interpreted against GD&T, and judged under an explicit decision rule. ISO 10360-13 is one relevant standard for optical 3D coordinate measuring systems, ISO 14253-1 sets conformity rules that account for measurement uncertainty, and ISO 1101 plus ASME Y14.5 define the drawing language that inspection software must interpret. Structured-light results also vary with configuration, working volume, point density, triangulation angle, targets, and surface properties, while controlled conditions such as 20 ± 0.5 °C remain common in dimensional metrology references. [1] [4] [5] [6] [8] [9]
Standards, traceability, and what “metrology-grade” means
A metrology 3D scanner for inspection is not “metrology-grade” because a vendor says so. In practice, that status depends on verified performance, explicit decision rules, and a traceable competence context. ISO 10360-13:2021 is one relevant standard for optical 3D coordinate measuring systems because it specifies acceptance tests for manufacturer-stated length performance and reverification tests for periodic user checks. NIST’s 2024 comparison of VDI/VDE 2634-2 and ISO 10360-13 found that the ISO 10360-13 length tests were more sensitive to certain structured-light model parameters, yet still did not detect every systematic error. Related instrument classes follow different documents: ISO 10360-8 applies to Cartesian CMMs with optical distance sensors, and ISO 10360-10 applies to laser trackers rather than handheld optical scanners in general. [1] [2] [20] [21]
Which standards apply to which scanner class
The standards landscape is broader than one document. ASTM’s 3D imaging standards page lists multiple relevant standards, including E2938-15(2023), E2641-09(2025), E3125-17(2025), and E3124-17(2025). That is a reminder that scanner evaluation is spread across several test methods and use cases. A quality control 3D scanner should therefore be assessed against the standard family that matches its measurement principle and application, not by assuming one universal umbrella applies to every optical system, scan arm, tracker-referenced setup, or 3D imaging workflow. [3]
Acceptance, reverification, and calibration cadence
Acceptance testing asks whether the installed system meets its specified performance. Reverification asks whether it still does so during periodic checks. Conformity decisions then move beyond the instrument test itself: ISO 14253-1 establishes rules for verifying conformity and nonconformity while taking measurement uncertainty into account, and its third edition replaces the old default coverage-factor shortcut with a default conformance probability of 95%. When traceability or accredited practice matters, ISO/IEC 17025:2017 provides the competence framework for testing and calibration laboratories. [1] [4] [7]
For GD&T inspection, the drawing language still governs the result. ISO 1101:2017 defines the geometrical specification symbols and interpretation rules used in many international workflows, while ASME lists Y14.5-2018 (R2024) as the current authoritative GD&T guideline in its US-oriented listing. In short, “metrology-grade” means verified capability plus correct interpretation, not a label on the scanner body. [5] [6]
How 3D scanning for quality control works
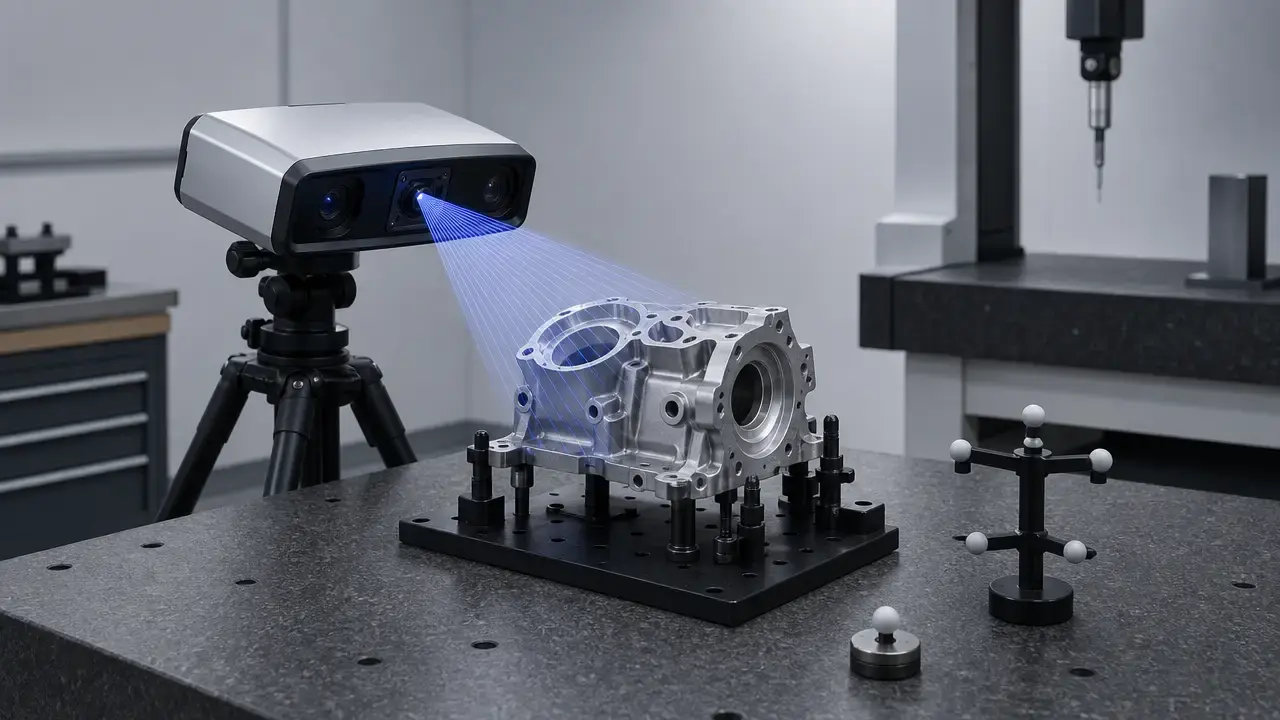
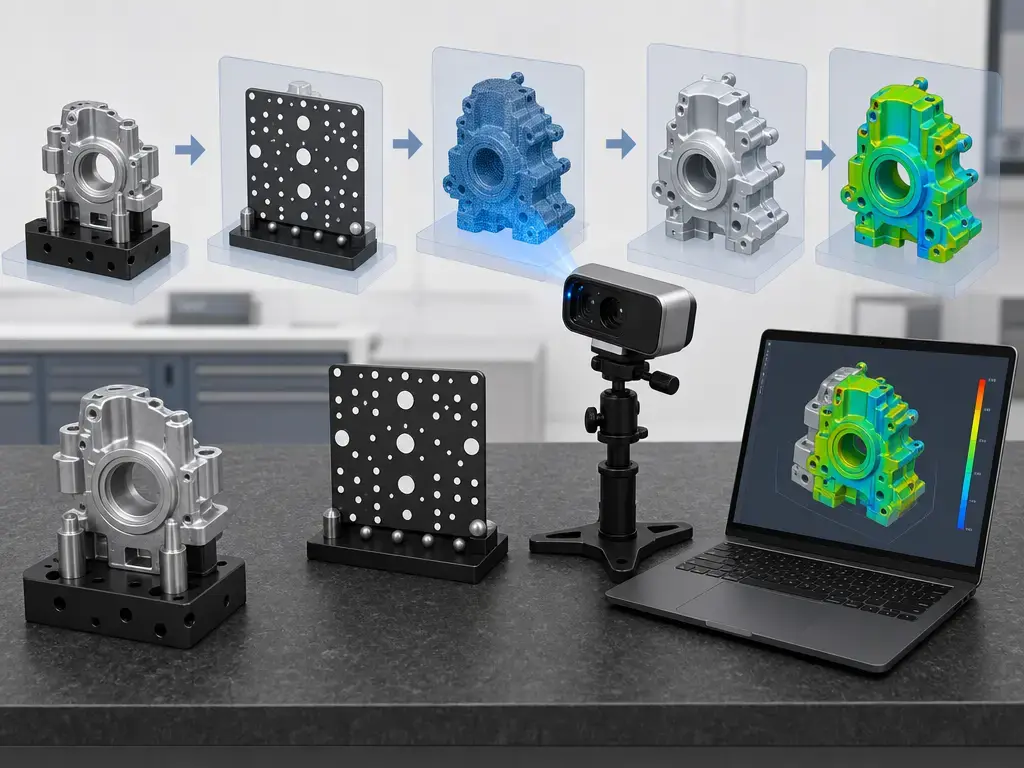
3D scanning for quality control works by converting the part into a point cloud or mesh and then evaluating that dataset against the engineering requirement. The capture step matters, but it is only one stage in inspection 3D scanning. Before the result can be trusted, the job has to define the nominal model, datum scheme, inspection features, and reporting objective. Surface condition, reflectivity, working volume, and setup choices can all influence what the scanner records, which is why real inspection practice includes instrument verification and environmental control before comparison begins. Inspection software then carries the process through alignment, feature extraction, CAD comparison, and reporting rather than leaving the decision to the scanner head alone. [8] [9] [16] [17] [18]
Core stages of an inspection scan
- Define inspection requirement and datum scheme.
- Prepare part and environment.
- Calibrate or verify scanner.
- Capture scan data.
- Register or align to CAD or datum features.
- Generate mesh or point-cloud checks.
- Evaluate tolerances and GD&T.
- Export inspection report and archive data.
Scanning produces measurement data; dimensional inspection applies datums, tolerances, GD&T logic, and reporting rules to that data. Software is therefore central to the workflow. Product documentation from PolyWorks, ZEISS INSPECT, and Geomagic Control X consistently presents alignment, comparison, feature measurement, and report generation as the stages that turn scan capture into a formal inspection result. [16] [17] [18]
Metrics that matter: accuracy, trueness, precision, repeatability, resolution, and uncertainty
These terms are related, but they are not interchangeable. Accuracy describes closeness to the true or accepted value. Trueness describes systematic closeness, or low bias. Precision describes how closely repeated results agree with each other. Repeatability is the short-range version of that consistency under the same operator, part, and conditions, while reproducibility asks whether the result transfers when operator, lab, instrument, or setup changes. Resolution, point spacing, and mesh density describe how finely the geometry is sampled or reconstructed, not whether the result is correct. Noise describes local scatter in the sampled data, and uncertainty describes quantified doubt around the reported result. For dimensional measurement, the conformity decision ultimately depends on uncertainty, because ISO 14253-1 requires conformity and nonconformity rules that account for it and sets a default conformance probability of 95%. [4] [8]
Metric table — what each number means and what it does not
| Metric | What it describes | Why it matters in inspection | Common pitfall |
|---|---|---|---|
| Accuracy | Closeness to the true or accepted value | Indicates overall dimensional measurement quality | Treating one published value as valid for every part and setup |
| Trueness | Systematic closeness, or low bias | Helps identify offset or calibration-related error | Treating it as the same thing as precision |
| Precision | Agreement among repeated results | Shows consistency | Assuming consistent results are automatically correct |
| Repeatability | Variation under the same conditions | Important for process checks and short-run verification | Using one repeatability number as a universal guarantee |
| Resolution / point spacing / mesh resolution | Sampling density or smallest reconstructed detail | Affects feature visibility and surface representation | Assuming finer sampling proves dimensional truth |
| Volumetric accuracy | How error behaves across a measurement volume | Matters for larger parts, assemblies, and longer spans | Reading a local number as a whole-volume guarantee |
| Uncertainty | Quantified doubt around the final result | Required for defensible pass/fail decisions | Reporting nominal values without the uncertainty context |
Manufacturer datasheets show why these categories must stay separate. One handheld metrology scanner lists 0.025 mm accuracy, 0.020 mm + 0.040 mm/m volumetric accuracy, 0.025 mm measurement resolution, 0.100 mm mesh resolution, 1,300,000 measurements/s, a 200–450 mm working distance, and a recommended part size of 0.05–4 m. The same product family also shows that volumetric accuracy can change with setup, including 0.020 mm + 0.015 mm/m when used with an Accu+ Kit. Another hybrid handheld scanner lists 0.02 mm accuracy, 0.02 + 0.033 mm/m volumetric accuracy, maximum field of view values of 520 × 510 mm or 600 × 600 mm depending on model, point distance ranges of 0.05–10 mm or 0.1–3 mm, and scan speed up to 3,600,000 points/s. Scan-arm and tracker-referenced systems publish different figures again, such as ±25 μm or ±30 μm probe accuracy with repeatability stated at 2σ, or 50 μm across a 60 m diameter measurement volume for a tracker-based system. Professional scanners may instead separate 3D point accuracy, 3D resolution, and accuracy over distance. [10] [11] [12] [13] [14] [15]
Data density vs correctness
Dense data do not automatically mean correct data. More points can improve feature visibility, but a fine mesh or small point spacing can still carry bias, misalignment, surface-related distortion, or poor uncertainty control. NIST’s structured-light work is a useful reminder that published specifications should be read as setup-specific examples, not universal truth for every part and workflow. [8]
Alignment and post-processing choices
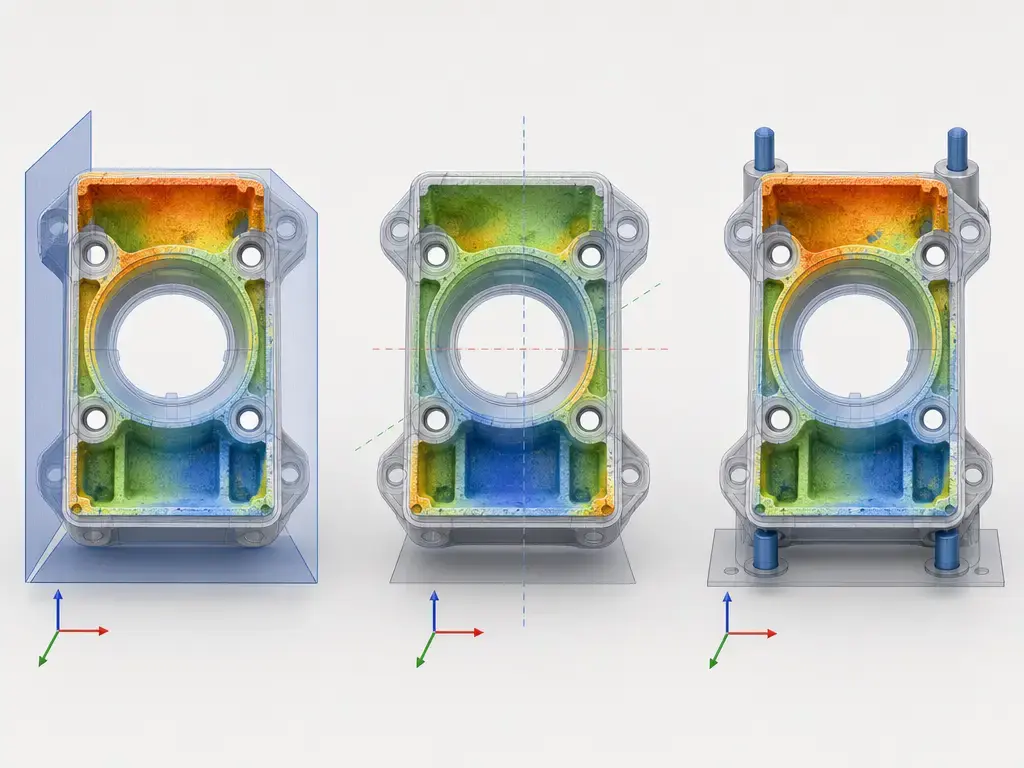
Best-fit, datum-based, feature-based, and RPS/fixture alignment
Alignment is not a neutral housekeeping step in CAD comparison. It defines what the software treats as “the same” between the measured part and the nominal model. Best-fit alignment can be useful for broad deviation analysis, but it can be invalid for datum-based inspection because it can translate or rotate the measured data into apparent agreement and hide functional nonconformance relative to the actual datum scheme. Datum-based, feature-based, and RPS or fixture alignment answer different questions, so the same scan can produce different inspection outcomes depending on the method chosen. Formal GD&T inspection still follows ISO 1101 or ASME Y14.5 logic, not the color map alone. [5] [6] [16] [17] [18]
Why meshing, filtering, smoothing, hole-filling, and feature extraction can change results
Post-processing can affect the result as much as capture. Commercial inspection software supports multiple alignment methods, mesh editing steps, and feature workflows before reporting, and those steps are not mathematically trivial. Meshing can alter how edges and surfaces are represented. Filtering and smoothing can reduce visible noise while also shifting local geometry. Hole-filling can create geometry that was never directly measured. Feature extraction can produce different diameters, planes, cylinders, or positions depending on which points are included and how the software fits the feature. As a result, a “cleaner” model is not automatically a more correct one. In deviation analysis and CAD comparison, the same raw scan can pass in one pipeline and fail in another if the alignment reference, processing order, or feature strategy changes. [16] [17] [18]
Scanner classes and where each fits
Different scanner classes solve different inspection problems, so the useful question is not which one is best in general, but which one matches the part, tolerance, access condition, and reporting need. ISO 10360-13 is relevant to optical 3D coordinate measuring systems, while related standards and test methods extend across other instrument classes and standards families. A quality control 3D scanner for shop-floor flexibility may be a handheld laser system, while a large fixture or assembly may need a tracker-referenced setup, and a scan arm may be better when tactile-style positioning and optical scanning must coexist. [1] [2] [3]
| Scanner class | Typical strength | Typical limitation | Best-fit QC use |
|---|---|---|---|
| Structured-light area scanner | Fast full-field surface capture | Sensitive to setup, surface behavior, and working-volume effects | Medium parts, fast CAD comparison, deformation checks |
| Handheld laser scanner | Portable coverage and flexible access | Local and volumetric performance both need review | Shop-floor part inspection, surface-rich geometry, mixed part sizes |
| Scan arm with laser probe | Combined positioning and scanning | Stand-off, depth of field, and scan width constrain access | Mixed tactile-plus-optical inspection, reachable features, fixture work |
| Tracker-based scanner | Large-volume measurement capability | Larger setup and infrastructure demand | Large assemblies, fixtures, aerospace or tooling volumes |
| CT scanner | Internal and inaccessible geometry | Higher complexity and different metrology tradeoffs than surface scanning | Hidden channels, trapped features, AM boundary cases |
Examples show the fit-for-purpose nature of each class. A handheld example lists a recommended part size of 0.05–4 m, a hybrid handheld lists mode-dependent field of view and point distance, a scan arm publishes stand-off of 115 mm, depth of field of 115 mm, and scan width of 80 mm to 150 mm, and a tracker-based system states accuracy within 50 μm across a 60 m diameter measurement volume. Optical scanners remain line-of-sight surface-measurement tools, while CT is best treated here as a boundary case for internal features that optical or tactile methods cannot directly reach. [10] [12] [13] [14] [15] [19]
Inspection workflow: CAD to report
A dimensional inspection job starts with the nominal CAD model and the product definition attached to it. PMI and GD&T specify what must be checked, while datum selection defines the reference frame used to judge the part. That is why the same mesh can support different conclusions depending on whether the task follows ISO 1101 rules or a US drawing workflow based on ASME Y14.5-2018 (R2024). Without that context, a visual comparison may look persuasive while still answering the wrong inspection question. [5] [6]
From there, software turns scan capture into a reportable result. The measured data are aligned to the nominal definition, then evaluated through color maps, sections, and extracted features such as planes, cylinders, holes, edges, and profile regions. Those outputs are useful for diagnosis, but color maps are visualization tools, not formal pass/fail decisions by themselves. Formal decisions depend on the datum scheme, applied tolerances, and the decision rule used for conformity. Product documentation from PolyWorks, ZEISS INSPECT, and Geomagic Control X emphasizes CAD comparison, feature workflows, GD&T-related evaluation, custom reporting, and data organization as parts of the same chain. CT can also enter that chain when hidden features must be measured, but it remains a boundary method rather than the default answer for ordinary surface inspection. Good practice also includes archiving the inspection project and raw measurement data so the basis of the inspection report can be revisited later. [16] [17] [18] [19]
Fit-for-purpose decision: when scan-based QC is appropriate
Scan-based QC is appropriate when the scanner’s verified capability, the part geometry, the environment, and the reporting standard all support a defensible decision. The right question is not “Can the scanner see the part?” but “Can the full process support the tolerance with known uncertainty?” ISO 14253-1 frames the conformity decision, ISO 1101 or ASME Y14.5 frames the drawing interpretation, and ISO/IEC 17025 matters when traceable calibration or competent lab practice is part of the requirement. No universal tolerance-to-uncertainty rule of thumb was found here, so the method choice has to be made against the actual part and the actual risk. [4] [5] [6] [7]
| Decision factor | If scan-based QC may fit | If another method may be better |
|---|---|---|
| Required tolerance vs verified uncertainty | Uncertainty is demonstrated and acceptable for the decision | Use CMM, gauges, or a tighter method |
| Part size vs validated working volume | Part fits the validated volume and setup | Use another scanner class or method |
| Surface and material behavior | Surface is scannable without severe reflectivity, translucency, or occlusion issues | Use tactile, CT, fixtures, spray strategy, or another method |
| Internal or hidden features | Inspection target is external and visible | Use CT or another internal-feature method |
| Environment | Temperature, stability, and handling are controlled and documented | Move to a controlled lab or change method |
| Reporting standard | CAD comparison and GD&T context are defined | A visual scan alone is not enough |
| Traceability and calibration need | Verification and traceability are documented | Recalibrate or outsource |
| Uncertainty budget | Available and reviewed | Result remains provisional |
| Data sufficiency for feature extraction | Measured data fully support the required features | Use probing, gauges, or a different sensor path |
Examples help set the boundary. One handheld scanner publishes 0.025 mm local accuracy, 0.020 mm + 0.040 mm/m volumetric accuracy, and a 0.05–4 m recommended part-size range, while an accessory changes the published volumetric figure to 0.020 mm + 0.015 mm/m. A hybrid handheld publishes its values under ISO/IEC 17025-accredited lab conditions of 20 ± 0.5 °C and 40–60% RH. NIST’s reflectivity example is even more cautionary: a 60% reflectance sample measured within 0.1 mm of calibrated value, while a 99% reflectance sample appeared recessed by 5.5 mm against a cited scanner specification of about 1 mm. Scan-arm, tracker-based, and CT methods cover different access and volume problems rather than serving as interchangeable upgrades. [9] [10] [11] [12] [13] [14] [19]
If the part is externally visible, the tolerance is supportable, and the workflow can produce a traceable inspection report, scan-based QC is often appropriate. If the geometry is hidden, the tolerance is too tight for the demonstrated uncertainty, or the reporting context cannot be defended, a different method is usually safer. [4] [7] [19]
Applications in manufacturing QC and process control
In manufacturing QC, 3D scanning is most useful where dense surface data, broad coverage, and fast visual comparison matter more than a few isolated contact points. Its value is speed of insight, provided the measurement discipline stays intact. [9]
Typical applications include first-article inspection, tooling validation, incoming inspection, reverse-engineering validation, deformation checks, fixture correction, and surface-rich part inspection where full-field deviation matters. Hybrid handheld systems illustrate why one scanner may cover several shop needs: mode-dependent field of view and point-distance ranges allow the same platform to move between wider coverage and finer local detail. Large structures and assemblies push the workflow toward tracker-based systems, which are designed for much larger measurement envelopes than handheld devices. [12] [14]
In process control, scan data can be trended to detect drift, warpage, machining allowance issues, recurring tool-wear signatures, or fixture-induced distortion before the problem becomes scrap. That is useful for troubleshooting and trend monitoring, though it should not be confused with a full SPC framework. Additive manufacturing is a useful boundary example: post-build part inspection may benefit from dense external scan data, but hidden internal geometry can force the workflow toward CT instead. The cited CT study measured more than 1000 locations per part, which shows the scale of information sometimes needed when internal performance-critical features are involved. [19]
Limitations: feature access, surfaces, and internal geometry
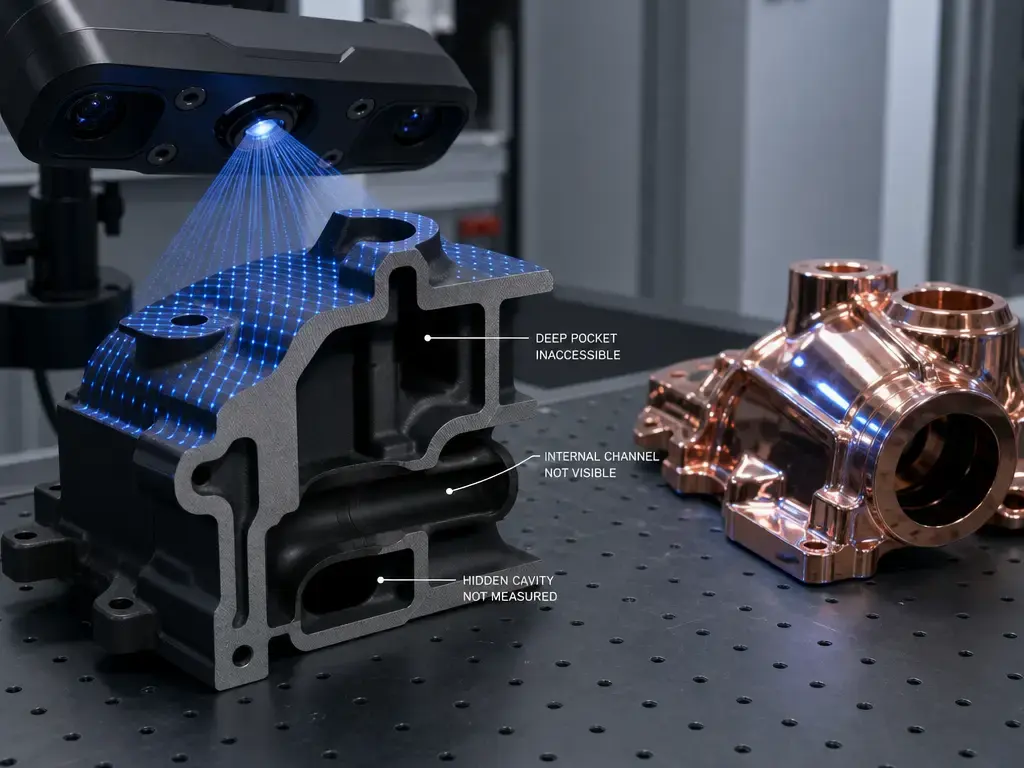
Optical 3D scanning is surface and line-of-sight only. It cannot directly measure geometry the sensor cannot see. That creates practical limits for reflective, translucent, dark, or highly textured surfaces, and also for sharp edges, holes, deep pockets, narrow slots, and very small features. Even ISO 10360-13 makes its scope conditional by stating that the surface characteristics of the scanned object, including glossiness and colour, are restricted and within a cooperative range. NIST’s structured-light work adds a broader warning: results depend on sensor configuration, projected patterns, working volume, point density, triangulation angle, targets, and surface properties, while performance tests still do not expose every systematic error. Shop-floor conditions add more variation through vibration, temperature drift, dust, lighting changes, and operator path dependence. [1] [2] [8]
The surface-finish boundary can be severe. NIST reports a case where a 60% reflectance sample was detected within 0.1 mm of calibrated value, while a 99% reflectance sample appeared recessed by 5.5 mm, several times larger than the cited scanner specification of about 1 mm. NIST’s large-scale dimensional metrology laboratory also illustrates how controlled some reference environments are, at 236 m² floor space, 3.5 m height, and 20 ± 0.5 °C. Manufacturer accuracy disclosures similarly cite controlled conditions such as 20 ± 0.5 °C and 40–60% RH. For internal geometry, optical scanning reaches a hard boundary. Hidden channels, trapped volumes, porosity-related questions, and inaccessible additive-manufacturing features generally need CT, sectioning, borescopes, gauges, or other methods. In the cited AM study, CT was used on 48 nozzle parts across 11 polymer materials and 3 AM processes, with over 1000 measurements per part and part-to-part variability within a single-material batch generally within 35 μm. CT belongs here as a boundary method, not a default replacement for optical scanners. [9] [12] [19]
Current research and market context
Recent research reinforces the same technical lesson: scanner performance is conditional. NIST’s structured-light publications emphasize that configuration, targets, working volume, surface properties, and data-processing choices all influence the result, and the 2024 NIST-backed study showed that ISO 10360-13 length tests were more sensitive than VDI/VDE 2634-2 to some model parameters while still missing some systematic errors. NIST reference facilities also operate under tightly controlled dimensional metrology conditions such as 20 ± 0.5 °C, which is a reminder that lab-grade performance does not automatically transfer to uncontrolled production floors. [2] [8] [9]
Market context is best kept qualitative here. No supported market-size claim is needed to see the direction of travel: vendors increasingly frame scanners as one part of a broader inspection software and quality-assurance workflow. [16] [17] [18]
That emphasis appears consistently in current documentation. PolyWorks highlights alignment construction, feature extraction, deviation analysis, first-article reporting, and multipiece statistics. ZEISS INSPECT presents a workflow from full-field data acquisition and mesh processing through inspection and reporting. Geomagic Control X emphasizes CAD-aware dimensioning, PMI support, GD&T callouts, comparisons, and custom reporting. Taken together, that documentation suggests that commercial differentiation increasingly sits in workflow integration, automation, and report generation rather than scan capture alone. Additive manufacturing reinforces the same pattern from the application side: dense external data are valuable, but internal features remain a boundary that can require CT-based inspection instead of optical measurement. [16] [17] [18] [19]
Practical takeaways for 3D scanning for quality control and inspection
3D scanning for quality control and inspection is strongest when dense surface data, fast part-to-CAD comparison, and visual deviation analysis matter. It becomes decision-ready only when standards, datum logic, alignment strategy, uncertainty handling, and reporting discipline are in place. Conformance still depends on uncertainty-aware rules under ISO 14253-1, correct GD&T interpretation under ISO 1101 or ASME Y14.5 where relevant, and realistic respect for surface behavior and environment. Internal features remain a boundary where CT or another method may be required. [4] [5] [6] [9] [19]
For dimensional inspection, the practical rule is straightforward: scan when the geometry is visible, the tolerance is supportable, and the report can be defended. Choose another method when the geometry is hidden or the conformity decision cannot be justified. [4] [19]
FAQ
These FAQ entries cover common questions about 3D scanning for quality control and inspection, including what a quality control 3D scanner is and where scan-based measurement stops being enough for a formal inspection decision.
How is 3D scanning used for quality control and inspection?
The part is scanned, aligned to CAD or datum references, compared through color maps or sections, and then evaluated through extracted features, GD&T checks, and reporting. The scan supplies the measurement data; the inspection workflow decides conformity. [5] [16] [17] [18]
What is a quality control 3D scanner?
A quality control 3D scanner is a scanner used inside a metrology workflow for comparison, measurement, and reporting. On its own, the hardware is not enough; verification, traceability, software, and decision rules still matter. [7] [16]
What is the difference between 3D scanning and dimensional inspection?
3D scanning captures geometry as points or meshes. Dimensional inspection evaluates that measured geometry against tolerances, datums, and specification rules to determine whether the part conforms. [4] [5]
When do you need a metrology 3D scanner for inspection?
You need a metrology 3D scanner for inspection when the job requires traceable, reportable measurement of complex visible geometry, especially for first-article inspection, supplier disputes, dense part-to-CAD comparison, or formal QA workflows. If the required features are hidden or the tolerance is beyond the demonstrated capability, another method may be better. [7] [19]
How accurate is 3D scanning for dimensional inspection?
There is no universal number. Accuracy depends on scanner class, part size, surface behavior, environment, alignment strategy, working volume, and the test method used to verify the instrument. A published local accuracy value, a volumetric figure, and the final uncertainty of the inspection result are related but different, which is why a defensible conformity decision must account for uncertainty rather than quoting one headline specification. [4] [8] [10] [12]
What is the difference between scan resolution, point spacing, and accuracy?
Resolution and point spacing describe sampling density or the smallest practical detail interval in the dataset. Accuracy describes closeness to the true or accepted value. A scanner can generate dense data with fine point spacing and still be wrong because of bias, surface effects, alignment error, or poor uncertainty control. Mesh density is therefore not proof of measurement correctness. [8] [10] [12] [15]
Can a 3D scanner replace a CMM?
Sometimes, for surface-rich parts where full-field coverage and speed matter more than isolated tactile points. Not universally. Tight tolerances, hidden features, datum-critical measurements, and some high-consequence features may still favor a CMM, gauges, CT, or a mixed workflow. [4] [19]
Sources
- ISO 10360-13:2021 optical 3D coordinate measuring systems
- NIST / Precision Engineering on VDI/VDE 2634-2 and ISO 10360-13 sensitivity
- ASTM 3D Imaging Standards
- ISO 14253-1:2017 decision rules
- ISO 1101:2017 geometrical tolerancing
- ASME Y14.5 Dimensioning and Tolerancing
- NIST ISO/IEC 17025:2017 listing
- NIST: Sources of Errors in Structured Light 3D Scanners
- NIST Advanced Dimensional Measurement Systems
- Creaform HandySCAN BLACK Series technical specifications
- Creaform HandySCAN BLACK Series brochure
- SHINING 3D FreeScan Combo Series
- FARO QuantumS FaroArm / ScanArm technical sheet
- Hexagon Absolute Scanner AS1
- Artec Leo PDF
- PolyWorks Inspector
- ZEISS INSPECT Optical 3D
- Hexagon Nexus / Geomagic Control X
- ScienceDirect: X-ray CT and internal AM features study
- ISO 10360-8:2013 CMMs with optical distance sensors
- ISO 10360-10:2021 laser trackers