
Summary
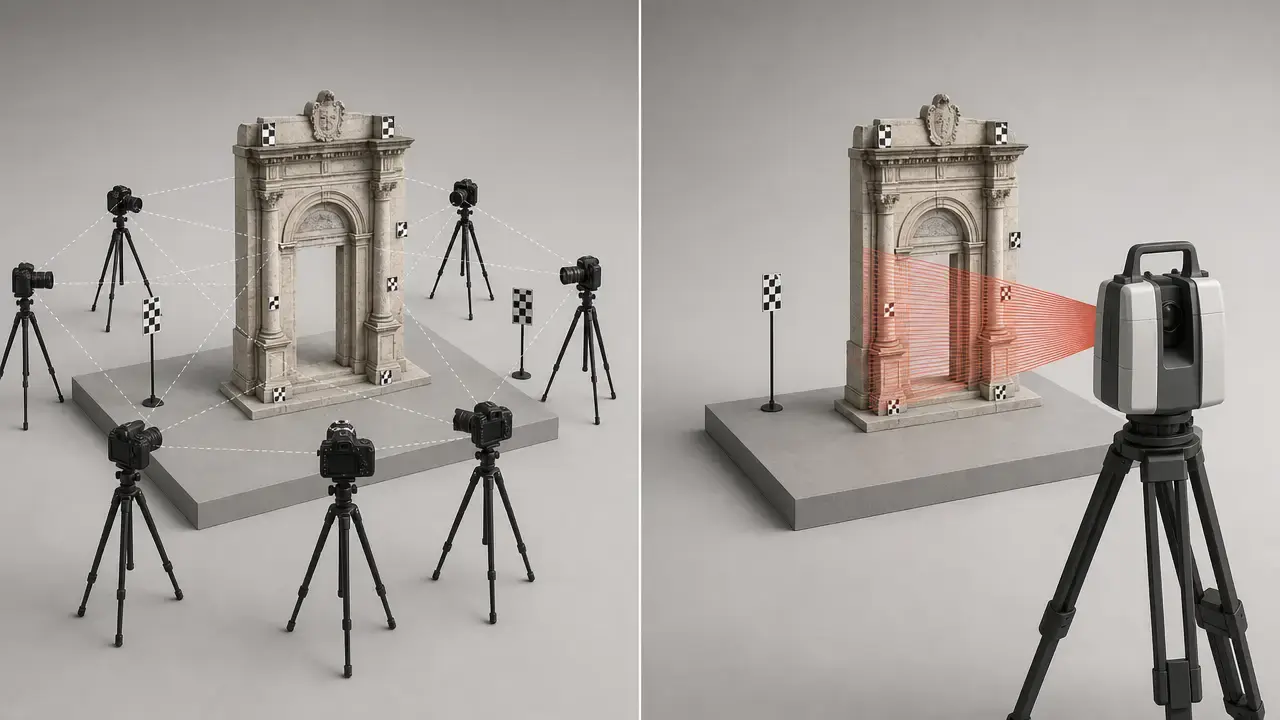
Photogrammetry vs lidar is usually a choice between image-driven reconstruction and direct ranging, not a contest with one universal winner. Photogrammetry often fits low-cost, color-rich visual models. LiDAR often fits direct geometry in weak texture, clutter, or vegetation.
The real decision variables are the deliverable, tolerance, surface behavior, lighting, occlusion, budget, and how you will validate the result. A mesh, point cloud, DSM, DTM, or as-built dimension can fail in different ways and needs different checks. This article uses standards-aware language on purpose: accuracy, precision, repeatability, and uncertainty are distinct terms, and your uncertainty budget is job-specific rather than implied by a headline spec. Hybrid workflows are often the most defensible option, with LiDAR carrying geometry or control context and photos carrying texture. [S04] [S05]
Quick decision table
Use this as a first-pass filter, not a substitute for a validation plan.
| Job goal | Choose photogrammetry when… | Choose LiDAR when… | Combine when… |
|---|---|---|---|
| Textured object/asset | the object has stable texture, you need a mesh or textured mesh, and you can place scale bars or check distances. | the object is weakly textured in part, or you need faster geometry capture with fewer image-matching dependencies. | you need LiDAR geometry plus photo texture, then validate with independent measurements. |
| Room/as-built | surfaces have enough texture and lighting is manageable, and you can add control targets or check distances. | you need direct geometry in sparse-feature interiors, or a mobile/TLS workflow is more practical. | you want cross-checks between point cloud and image-derived surfaces, with checkpoints or target checks. |
| Site/terrain | the site is open, textured, and you can establish GCPs or RTK/PPK control. | you need bare-earth or vegetation structure, or the terrain is partly hidden. | you need a DSM from one method and a control network from the other, then compare cross-sections. |
| Vegetation/canopy | the canopy is sparse, lighting is stable, and your aim is a visual surface rather than bare earth. | you need canopy structure, ground observations, or terrain under vegetation. | you need both canopy shape and a validated terrain model, checked against control or cross-sections. |
| Time-critical capture | the scene is simple, textured, and you can capture enough overlap quickly. | you need a faster direct geometry pass and can accept post-processing for registration or trajectory. | you need one fast geometry pass plus photos for texture or review, then verify with checkpoints. |
If you are choosing photogrammetry or lidar for 3D scanning, let the table push you toward the deliverable first and the sensor second. In practice, “best” means “best for the required metric and validation method.” [S05]
Standards & metrics map
No single cross-domain standard covers photogrammetry vs LiDAR end to end. The point of standards here is to separate terminology and test scope, not to crown a winner. In metrology language, accuracy is closeness to a true value, precision is closeness among repeated results, repeatability is closeness under the same conditions, and uncertainty is the quantified doubt attached to a result. [S01] [S02] [S04] [S05]
| Document | What it standardizes | What it does NOT mean | Where we use it here |
|---|---|---|---|
| ISO 17123-9 | field procedures for terrestrial laser scanners. | not an acceptance test or a comprehensive evaluation. | TLS field checks and repeatability language. [S01] |
| ASTM E2938 | relative-range performance for medium-range 3D imaging systems operating within at least part of the 2–150 m range. | not full calibration, and it cannot quantify constant offset error. | medium-range LiDAR performance framing. [S02] |
| ASTM E2807 / E57 | exchange of 3D point data, attributes, and 2D imagery. | not proof of accuracy or interoperability quality. | file-format and archive discussion only. [S03] |
| ASPRS positional accuracy standards | positional accuracy reporting for mapped and geospatial products. | not a universal object-scanning rulebook. | geospatial deliverables context. [S07] |
| VIM and GUM | metrology vocabulary and uncertainty thinking. | not a scanner performance spec. | terminology and validation framing. [S04] [S05] |
One important warning: E57 is a data container and exchange spec, not evidence that a scan is accurate. A well-formed file can still encode a poor survey. [S03]
Photogrammetry vs LiDAR: core technical difference
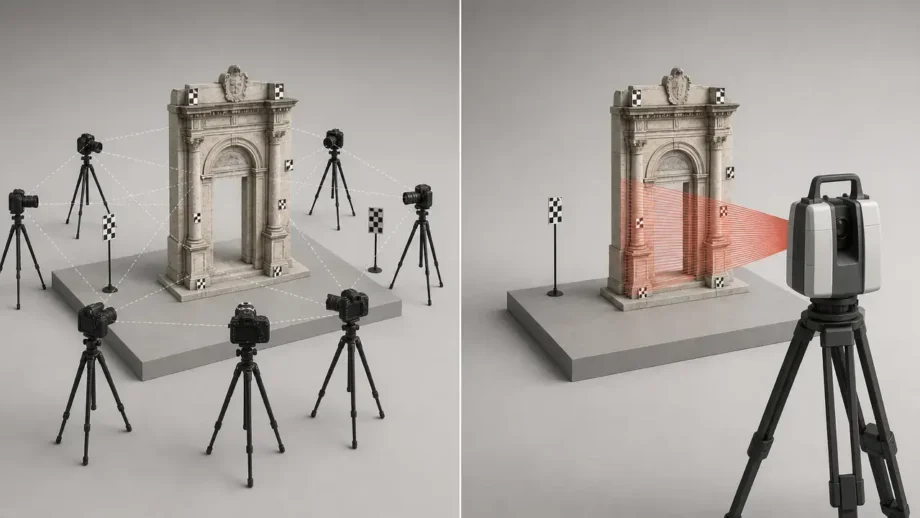
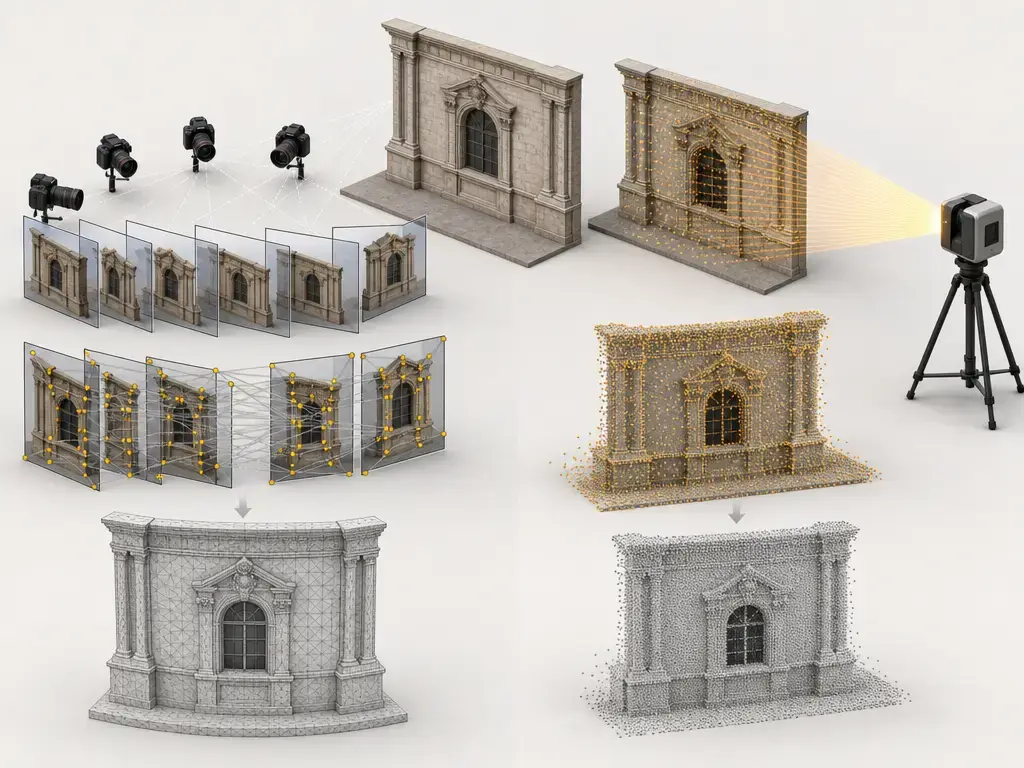
Photogrammetry is passive image-based reconstruction. You capture overlapping photographs, extract features, match them across views, and triangulate 3D structure from those correspondences. In a modern structure-from-motion workflow, feature detection and extraction come first, followed by feature matching and geometric verification, then structure-and-motion reconstruction. [S24]
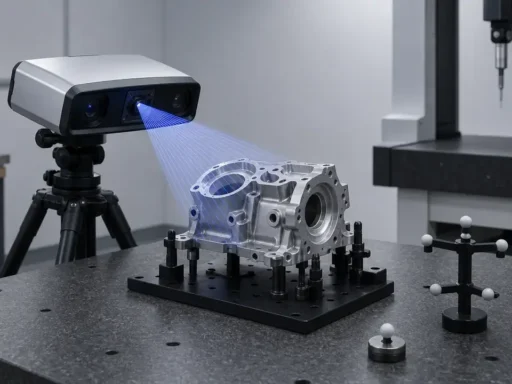
LiDAR is active ranging. The sensor emits laser energy, measures the returned signal, and converts those measurements into a point cloud. The geometry comes from range measurements plus scan angles, not from visual correspondence between images. In practice, the scan rarely stands alone: multiple scans, or a moving system, still need registration or trajectory estimation to place all points into one frame.
The practical implication is simple. Photogrammetry depends on stable appearance and matchable detail. LiDAR depends on returned energy, line of sight, and robust registration. Both can fail in the field, but they usually fail for different reasons.
How photogrammetry works
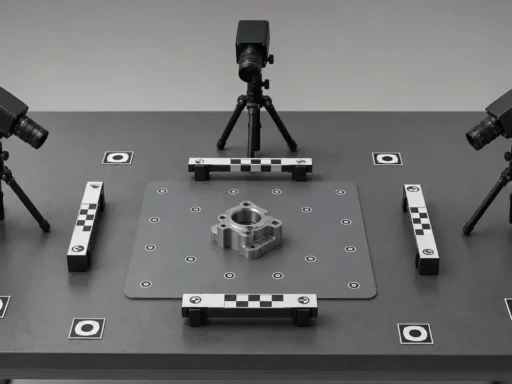
Photogrammetry starts with capture geometry. You need enough overlap, enough baseline change between views, and enough viewpoint diversity for parallax to constrain depth. Calibrated or self-calibrating camera models then estimate pose and lens behavior, while the image network carries the geometry. Weak networks, such as mostly parallel viewpoints with little baseline variety, can leave the solution underconstrained. Rolling shutter can also distort the reconstruction if the camera or subject moves too quickly. SfM typically reconstructs scene geometry in a relative coordinate system (up to a similarity transform) — it becomes metrically useful only after you add scale and/or georeferencing constraints and then validate the result. [S23] [S16]
Without geographic reference data, photogrammetry software can still create a local coordinate system, and a scale bar provides a known distance for measurement, but not a full coordinate system. Aerial workflows may also use GCPs, RTK/PPK camera positions, and checkpoints to constrain and verify the model. Outputs often progress from sparse tie points to dense point clouds or depth maps, then to meshes and textures. In aerial work, orthomosaics and DSMs are common deliverables, but they still inherit the quality of the image network and the control strategy. [S23] [S16]
Photogrammetry needs…
- overlap between images.
- enough texture for feature matching.
- a stable subject and stable lighting.
- scale reference, GCPs, or another georeferencing strategy.
- varied viewpoints with real parallax.
- calibration stability during capture and processing.
How LiDAR works
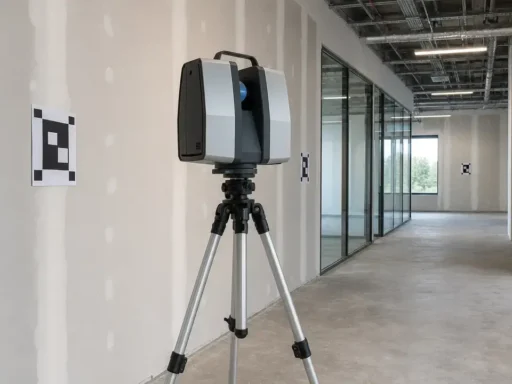
LiDAR measures distance directly by laser ranging. In a single terrestrial scan, the instrument samples the visible scene from one station. In multi-scan or mobile workflows, those samples must be registered or trajectory-solved into a common coordinate system. That registration step is not a bookkeeping detail; it is often a major contributor to deliverable error. NIST’s TLS review is useful here because it separates range error, range noise, and angular uncertainty instead of flattening them into one brochure number. [S08]
The output is usually a point cloud first. Intensity or color may be stored as attributes, and mesh reconstruction comes later if the workflow needs a surface model. ASTM E2938 frames medium-range relative-range performance for systems operating within at least part of the 2–150 m range, and it also makes clear that field conditions matter. NIST likewise reports that TLS performance spans a few tens to a few hundreds of meters, with range errors from sub-millimeter to several millimeters, range noise of a few hundred micrometers, and angular uncertainties of tens of arc-seconds. [S02] [S08]
LiDAR performance depends on…
- target reflectivity or albedo.
- incidence angle.
- stand-off distance.
- scan settings.
- environment, including object geometry or texture, temperature, reflectance, vibration, particulate matter, thermal gradients, ambient lighting, and wind. [S02]
- registration or trajectory quality.
- point spacing, which depends on distance and settings, and in mobile or aerial capture also depends on speed and overlap. [S22]
Types & taxonomy
Photogrammetry is not one thing. Object and turntable workflows favor small subjects and controlled lighting. Handheld capture is useful for quick close-range work. Room-scale photogrammetry is common for interiors and small spaces. Drone or aerial photogrammetry is the standard path for roofs, façades, sites, stockpiles, and orthomosaics.
LiDAR is also a family of methods. Terrestrial laser scanning, or TLS, is tripod-based and static. UAV LiDAR adds a platform and a trajectory solution. Mobile or handheld SLAM LiDAR relies on motion estimation and loop closure. Industrial systems may be optimized for a narrow field of view or a specific range band. Phone and tablet depth sensors are a separate low-stakes class. Apple describes the LiDAR Scanner in the iPad Pro as measuring distance up to 5 m. No reliable figure found for metrology-grade accuracy on that official page. [S25]
Not directly comparable: static TLS point accuracy specs ≠ UAV LiDAR system accuracy ≠ SLAM drift behavior ≠ phone depth sensing.
| Method | Typical capture setup | Best fit | Main caveat |
|---|---|---|---|
| Object/turntable photogrammetry | controlled lighting, multiple views, small subject | small parts, collectibles, visual assets | scale ambiguity without control |
| Handheld or room-scale photogrammetry | walking capture, overlapping images, interior lighting | interiors, props, small rooms | weak geometry and rolling-shutter risk |
| Drone photogrammetry | UAV image grid, GCPs or RTK/PPK | terrain, façades, stockpiles, DSMs | texture and lighting dependence |
| Terrestrial laser scanning | tripod station scans from multiple setups | rooms, façades, industrial scenes | registration dependency |
| UAV LiDAR | aircraft trajectory plus ranging sensor | terrain, canopy, corridor mapping | system accuracy depends on trajectory and mission design |
| Mobile or SLAM LiDAR | walking or vehicle motion with loop closure | interiors, fast capture, corridor surveys | drift and closure sensitivity |
| Phone/tablet depth sensing | short-range consumer device | quick previews, rough spatial capture | not metrology-grade |
Photogrammetry vs LiDAR accuracy
Stop comparing the wrong numbers
The phrase photogrammetry vs lidar accuracy is easy to misuse because the numbers are often not the same kind of number. Range error, 3D point accuracy, system accuracy, registration residuals, checkpoint RMSE, and mesh detail are related, but not interchangeable. A scanner can have good point repeatability and still produce a poor deliverable if registration or control is weak. A photogrammetry mesh can look highly detailed and still carry scale error if the model is not properly constrained. [S04] [S05] [S08] [S23]
Do not compare these as if they were the same metric…
- range error.
- 3D point accuracy.
- system accuracy.
- checkpoint RMSE.
- registration residuals.
- mesh detail or texture sharpness.
- registration residuals are not independent accuracy.
NIST notes that TLS tests often yield derived target-center points that are more accurate than individual scan points, so it is wrong to assume a manufacturer’s maximum permissible error applies to every point in the cloud. ASTM E2938 is also relative-range only, so it does not tell you everything about a system’s offset or full 3D accuracy. [S08] [S02]
Device-class examples, with conditions
Vendor numbers are only meaningful with their conditions attached. FARO’s Focus brochure gives reflectivity-dependent range examples, including white 90% at 0.5–400 m, 0.5–200 m, or 0.5–100 m depending on model, dark-grey 10% at 0.5–150 m, and black 2% at 0.5–50 m; it also lists 3D accuracy of 2 mm at 10 m and 3.5 mm at 25 m, ranging error ±1 mm, and max speed up to 2 MPts/s. Leica’s BLK360 spec sheet lists range 0.5–45 m, point rate up to 680,000 pts/s, and 3D point accuracy 4 mm at 10 m at 78% albedo. DJI’s Zenmuse L2 manual lists detection range 450 m at 50% reflectivity and 0 klx, or 250 m at 10% reflectivity and 100 klx, with point cloud rates of 240,000 pts/s in single-return mode and 1,200,000 pts/s in multiple-return mode, system accuracy H 5 cm and V 4 cm at 150 m, ranging accuracy 2 cm at 150 m RMS 1σ, and an example density of 76/m² at 150 m altitude, 15 m/s, 0% overlap, and 240 kHz. In a very different context, one built-heritage photogrammetry study reported an average difference of 0.35% against topographic survey and RMS precision of 1.15 pixel for the points used. [S20] [S21] [S22] [S11]
What good validation looks like
For photogrammetry, do not trust reprojection error alone. Use checkpoints, check distances, scale-bar residuals, and independent measurements. If you have GCPs, separate the points used to constrain the model from the points used to test it. That is the difference between fitting a model and validating a deliverable. [S05] [S16] [S23]
For LiDAR, do not trust registration residuals alone. Use independent targets or check geometry, repeat scans, and cross-sections against control. On mobile systems, a route can look locally good and still drift globally, so loop-closure claims do not replace independent validation. ISO 17123-9 is useful as a field-check mindset, but it is not a blanket acceptance test, and the final uncertainty budget is still job-specific. [S01] [S05] [S10]
Workflow: capture to usable 3D deliverable
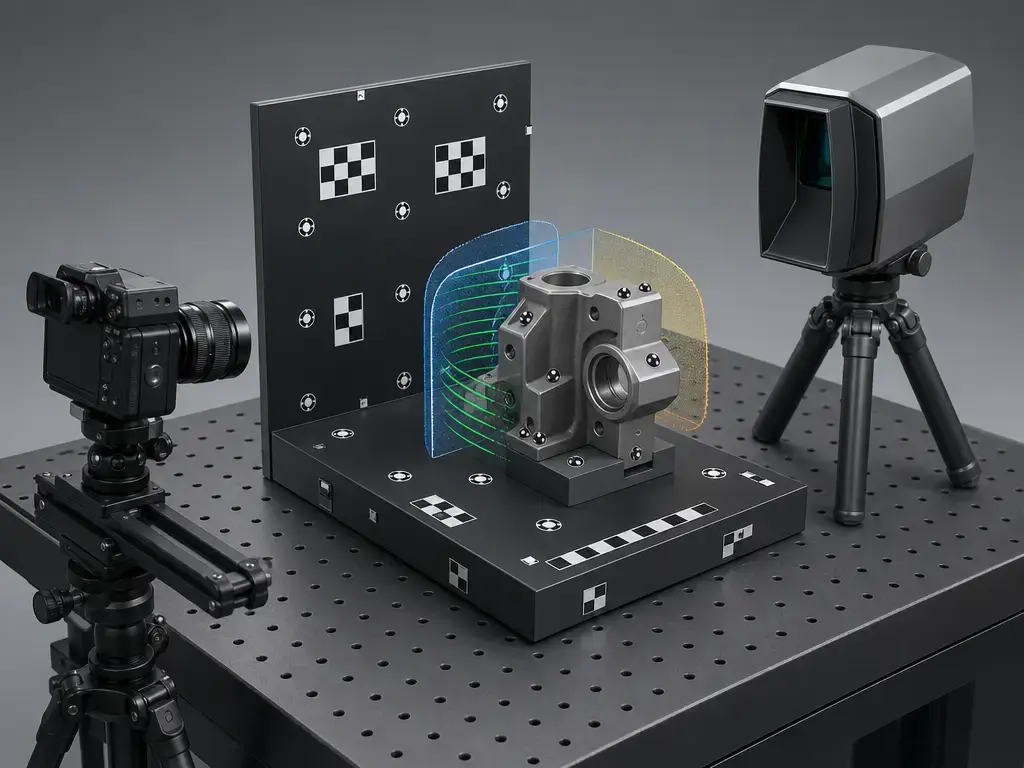
Photogrammetry workflow is usually: plan coverage, capture overlapping images, align the photos, add scale or georeferencing, build the dense reconstruction, generate a mesh or textured model, and validate with checkpoints or independent distances. The decisive step is not the dense cloud by itself; it is the moment you anchor the result to real-world scale and then test it. [S23] [S24]
LiDAR workflow is usually: capture the scene, solve registration or trajectory, clean or classify the point cloud if needed, generate surfaces or cross-sections, and validate against targets, control, or repeat runs. If the deliverable is a terrain model, classification becomes part of the workflow rather than an optional post-process. [S06]
A hybrid workflow is worth the extra effort when geometry and appearance both matter. LiDAR can provide the structural skeleton or control context, while photos provide texture or add visually useful surface information.
Applications: which should you use?
Start with the deliverable and tolerance. If you cannot state what the final product is supposed to be, you cannot choose the method intelligently. A point cloud by itself is not a deliverable.
For objects and assets, the deliverable is often a mesh or textured mesh, so the main checks are scale bars, check distances, and independent measurements. For rooms and buildings, the deliverable may be an as-built model or deviation map, so the primary metric shifts toward checkpoints, control-network residuals, cross-sections, or known dimensions. For terrain and vegetation, separate DSM from terrain products: USGS defines a DSM as elevations of top surfaces such as trees and buildings above bare earth, while DTM in U.S. usage can refer to a vector dataset with breaklines and mass points rather than a surface itself. Multiple returns improve the chance of ground observations, but terrain quality under canopy still depends on canopy density, scan geometry, point density, and ground classification workflow. For indoor mobile scanning, remember that SLAM systems can be locally good while still drifting globally; one ISPRS evaluation reported a mean deviation of 5 mm but a maximum deviation of 1.79 m in one tower dataset, while other local comparisons reached about 1 cm and plane-fit noise standard deviations of 3.0 mm for TLS, 3.8 mm for ZEB-REVO RT, and 5.7 mm for LiBackPack C50. [S06] [S10]
| Use case | Prefer photogrammetry when… | Prefer LiDAR when… | How to validate (metric + method) |
|---|---|---|---|
| Objects/assets | the asset is textured and you need a mesh or textured mesh. | the asset has weak texture or needs rapid direct geometry. | metric: check distances or scale-bar residuals; method: independent measurements. |
| Rooms/buildings | lighting and access are manageable, and you can place control. | interiors are sparse-feature, cluttered, or need faster geometry capture. | metric: checkpoints or deviation from control; method: target checks and cross-sections. |
| Construction/as-built | you can image enough surfaces and tie the model to known dimensions. | you need direct geometry across occlusion or over larger interiors. | metric: known-dimension error or deviation map; method: control network plus check distances. |
| Heritage | surfaces are image-friendly and you need a visually rich record. | geometry is complex, occluded, or partly inaccessible. | metric: checkpoint RMSE or survey-line deviation; method: independent survey lines and checkpoints. |
| Terrain/vegetation | the area is open and texture is sufficient for a reliable image network. | you need canopy structure or bare-earth estimation under vegetation. | metric: DSM/terrain checks; method: control points, check areas, and cross-sections. |
| Stockpiles | the pile is accessible, stable, and lighting is controlled. | you need faster geometry with fewer texture dependencies. | metric: volume repeatability; method: repeat scans and control-based volume checks. |
The table is the practical version of the whole article: define the deliverable, name the metric that matters, and decide in advance how you will validate it.
Limitations & failure modes
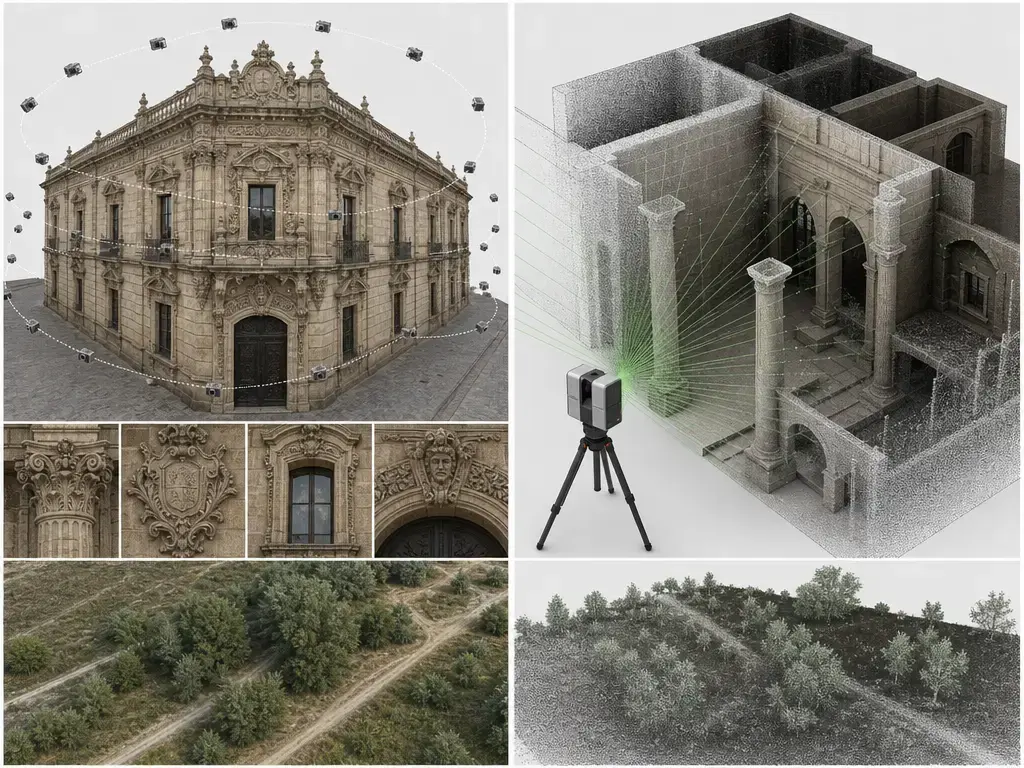
Photogrammetry usually fails first on scene appearance and capture geometry. Low texture, glare, specular surfaces, transparency, repetitive patterns, motion, rolling shutter, weak geometry, and calibration drift can all break feature matching or distort the reconstruction. Recent work on reflective, transparent, and low-texture objects underlines that these surfaces remain difficult for image-based reconstruction. [S15]
LiDAR fails differently. Occlusion, glass, water, black or absorptive surfaces, multipath or mixed pixels, grazing angles, long-range signal drop, registration drift, and loop-closure issues in SLAM systems can all reduce deliverable quality. A route can look locally convincing while still missing parts of the scene or drifting over distance. [S10]
The operational lesson is simple: collect validation data during capture. Add checkpoints, targets, cross-sections, and repeat runs while you are still on site. Missing control or check data cannot be fully repaired later in software.
Short history
Early photogrammetry is often linked to Laussedat, who used photographs for topographic surveys in 1861 and is associated with metrophotography. The modern version is far more automated, but it still rests on the same basic idea: infer geometry from images. [S12]
LiDAR developed along a different path. Airborne laser scanning was already being summarized in a 1999 overview, and NIST notes that terrestrial laser scanners first became commercially available in the late 1990s. [S13] [S08]
Decision guide: photogrammetry vs lidar in practice
For photogrammetry vs lidar, the right choice is conditional, not absolute. If you need a color-rich mesh from textured surfaces and can control scale, photogrammetry is often the better starting point. If you need direct geometry through weak texture, clutter, or vegetation, LiDAR is often the safer starting point.
The final rule is straightforward: specify the deliverable, tolerance, and validation plan first, then choose the method or methods. If you need measured shape plus appearance, a hybrid workflow is often the most defensible answer. Do not say “LiDAR is more accurate” unless you immediately narrow that claim by platform, metric, and conditions. [S05]
FAQ
1) What is the difference between photogrammetry vs lidar for 3D scanning?
Photogrammetry reconstructs 3D from overlapping images by matching features and triangulating geometry. LiDAR measures distance directly with laser ranging and builds a point cloud from returned signals. The first is more dependent on appearance and camera geometry; the second is more dependent on line of sight, reflectivity, and registration. In practice, they can produce similar-looking outputs, but the error sources are different. [S24] [S02]
2) Which is more accurate: photogrammetry vs lidar?
It depends on the metric. If you mean checkpoint RMSE on a controlled site, a well-run TLS survey may outperform an image model. If you mean visual surface richness, photogrammetry may look better. Accuracy, precision, repeatability, range error, system accuracy, and deliverable accuracy are not interchangeable, so you have to compare like with like. The useful question is not which is better, but which metric matters for this job. [S04] [S05] [S08]
3) Should I use photogrammetry or LiDAR for scanning a room (as-built)?
Use photogrammetry if the room has enough texture, lighting is manageable, and you can place targets or scale references. Use LiDAR if the room is cluttered, sparse-feature, or needs faster geometry capture. For either method, validate against check distances or targets, not just software residuals. If the scan is mobile or SLAM-based, also test for global drift, not only local alignment. [S10] [S01]
4) Is LiDAR or photogrammetry better for drone mapping (DSM/DTM + vegetation)?
If your deliverable is a DSM of roofs, stockpiles, or canopy tops, photogrammetry can work well in open, textured areas. If you need a terrain product under vegetation, LiDAR usually has the advantage because it can improve the chance of ground observations through canopy gaps. But that is not a guarantee: terrain quality still depends on canopy density, scan geometry, point density, and classification workflow. [S06]
5) Why does photogrammetry need scale bars or GCPs?
Because SfM starts in a relative coordinate system. Without external control, you can get a coherent model, but not an inherently scaled or georeferenced one. Scale bars give known distances, while GCPs or RTK/PPK data can anchor the model to real-world coordinates. That is why a project can look visually correct and still be the wrong size unless you validate scale and orientation. [S23] [S16]
6) Expert: How do I validate LiDAR registration quality versus deliverable accuracy?
Treat them as two different tests. Registration quality tells you how well scans align to each other. Deliverable accuracy tells you how close the final product is to independent truth. Use registration residuals for internal alignment, but also check independent targets, cross-sections, and measured distances against control. ISO 17123-9 supports field-procedure thinking, but it is a field verification standard, not a blanket acceptance test. [S01] [S05]
7) Expert: What conditions make SfM self-calibration unreliable, and how do I mitigate it?
Self-calibration becomes fragile when the image network is weak, viewpoints are mostly parallel, texture is repetitive, rolling-shutter distortion is significant, or the scene lacks strong depth variation. Low overlap and poor lighting make it worse. Mitigate the problem with convergent viewpoints, good overlap, stable exposure, control points or scale bars, and an independent validation set. If the deliverable is metric, never rely on reprojection error alone. [S15] [S16] [S23]
Sources
Citations in the body use the format [[S##]](#sources) after punctuation.
- S01 – ISO 17123-9:2018 Optics and optical instruments – Field procedures for testing geodetic and surveying instruments – Part 9: Terrestrial laser scanners. https://www.iso.org/standard/68382.html
- S02 – ASTM E2938-15R23 Standard Test Method for Evaluating the Relative-Range Measurement Performance of 3D Imaging Systems in the Medium Range. https://store.astm.org/standards/e2938
- S03 – ASTM E2807-11R19 Standard Specification for 3D Imaging Data Exchange, Version 1.0. https://store.astm.org/e2807-11r19.html
- S04 – JCGM 200:2012 International Vocabulary of Metrology (VIM3). https://www.bipm.org/documents/20126/41373499/JCGM_200_2012.pdf/
- S05 – JCGM 100:2008 Evaluation of measurement data – Guide to the expression of uncertainty in measurement. https://www.bipm.org/documents/20126/2071204/JCGM_100_2008_E.pdf
- S06 – USGS Lidar Base Specification Version 2.1. https://d9-wret.s3.us-west-2.amazonaws.com/assets/palladium/production/s3fs-public/atoms/files/Lidar-Base-Specification-version-2-1.pdf
- S07 – ASPRS Positional Accuracy Standards page. https://asprs.org/Main/Main/Standards/Positional-Accuracy-Standards.aspx
- S08 – NIST, Performance Evaluation of Terrestrial Laser Scanners: A Review. https://tsapps.nist.gov/publication/get_pdf.cfm?pub_id=930840
- S09 – Structure-from-Motion Revisited. https://openaccess.thecvf.com/content_cvpr_2016/html/Schonberger_Structure-From-Motion_Revisited_CVPR_2016_paper.html
- S10 – Indoor evaluation of mobile scanning systems. https://isprs-archives.copernicus.org/articles/XLIV-4-W1-2020/119/2020/isprs-archives-XLIV-4-W1-2020-119-2020.pdf
- S11 – Close-range photogrammetry and topographic survey comparison for built heritage. https://isprs-archives.copernicus.org/articles/XL-5/607/2014/isprsarchives-XL-5-607-2014.pdf
- S12 – Aime Laussedat and early photogrammetry history. https://isprs-archives.copernicus.org/articles/XLIII-B2-2020/893/2020/isprs-archives-XLIII-B2-2020-893-2020.pdf
- S13 – Airborne laser scanning, an introduction and overview. https://citeseerx.ist.psu.edu/document?doi=43b07d223931f7b93caa79cbe19ae0787a841d21&repid=rep1&type=pdf
- S14 – The interpretation of structure from motion. https://pubmed.ncbi.nlm.nih.gov/34162/
- S15 – 3DReflecNet: A Large-Scale Dataset for 3D Reconstruction of Reflective, Transparent, and Low-Texture Objects. https://openaccess.thecvf.com/content/CVPR2026/papers/Liang_3DReflecNet_A_Large-Scale_Dataset_for_3D_Reconstruction_of_Reflective_Transparent_CVPR_2026_paper.pdf
- S16 – UAV SfM georeferencing and similarity transformation discussion. https://www.mdpi.com/2504-446X/4/3/55
- S17 – UAS photogrammetry vs LiDAR DSM comparison. https://www.mdpi.com/2072-4292/12/17/2806
- S18 – UAV LiDAR vs UAV-DAP forest attributes. https://doi.org/10.3390/f10020145
- S19 – Vineyard canopy comparison study. https://www.sciencedirect.com/science/article/pii/S0168169923004970
- S20 – FARO Focus brochure. https://media.faro.com/-/media/Project/FARO/FARO/FARO/Resources/1_BROCHURE/2024/FARO-Focus/AECO/CMO9773_Brochure_FocusPremiumMax_AECO_ENG_LT_Web_112024.pdf?rev=32d2a3ce59b943828b19a6a2e5374d94
- S21 – Leica BLK360 spec sheet. https://shop.leica-geosystems.com/sites/default/files/2025-07/BLK360-Spec-Sheet-v2.pdf
- S22 – DJI Zenmuse L2 User Manual. https://dl.djicdn.com/downloads/Zenmuse_L2/20240222/Zenmuse_L2_User_Manual_v1.0_EN.pdf
- S23 – Agisoft Metashape Pro Manual v2.3. https://www.agisoft.com/pdf/metashape-pro_2_3_en.pdf
- S24 – COLMAP Tutorial. https://colmap.readthedocs.io/en/latest/tutorial.html
- S25 – Apple iPad Pro LiDAR newsroom note. https://www.apple.com/uk/newsroom/2020/03/apple-unveils-new-ipad-pro-with-lidar-scanner-and-trackpad-support-in-ipados/
- S26 – Pix4D LiDAR and photogrammetry comparison page. https://www.pix4d.com/blog/LiDAR-photogrammetry-point-cloud-comparison
- S27 – Propeller Aero LiDAR vs photogrammetry comparison page. https://www.propelleraero.com/blog/lidar-vs-photogrammetry/
- S28 – KIRI Engine 3DGS vs photogrammetry vs LiDAR. https://www.kiriengine.app/blog/3DGSvsPhotogrammetryvsLiDAR