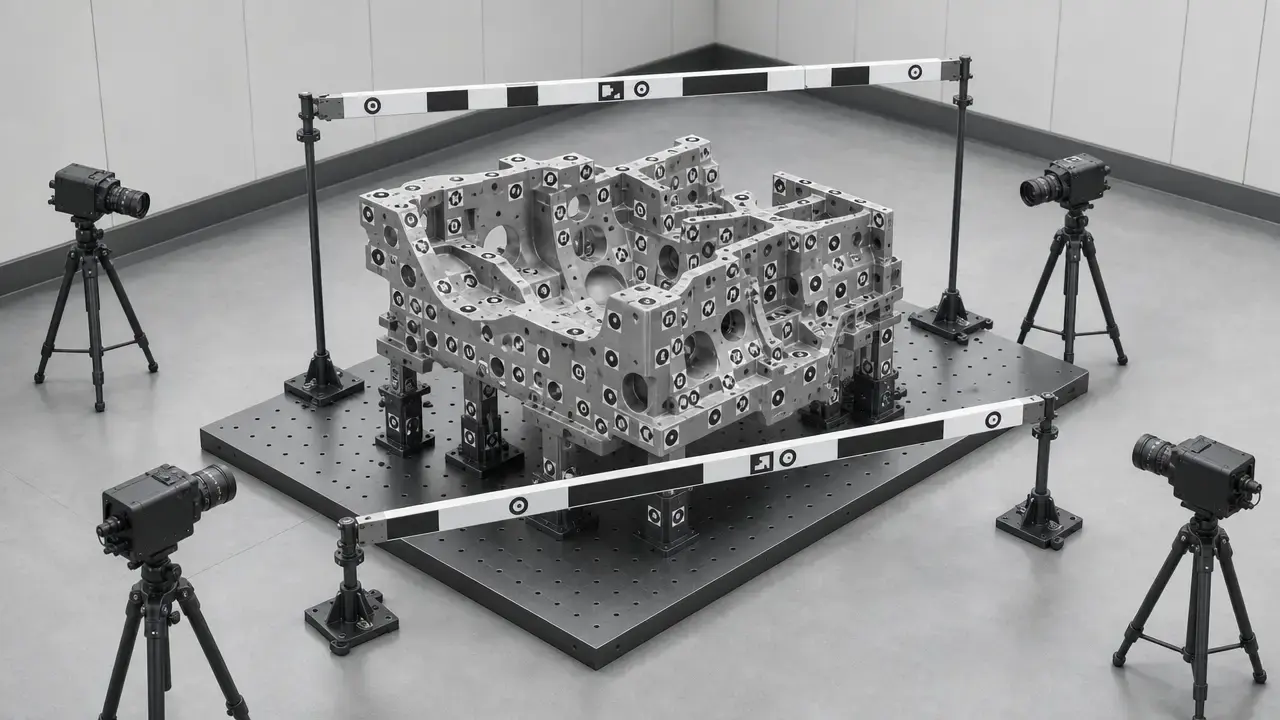

Summary: photogrammetry vs laser scanner in industrial metrology
In this article, “photogrammetry beats a laser scanner” means that, for a specified deliverable and a stated task uncertainty target, target-based industrial photogrammetry provides more reliable volumetric control and/or lower total field-plus-setup burden than a laser scanning workflow whose primary output is dense surface geometry. It does not mean universally better accuracy or better surface detail. [1] [3] [6]
That distinction matters because industrial metrology choices start with the deliverable, then move to measurement volume, uncertainty target, density needs, setup burden, and verification method. Target-based photogrammetry is strongest when the job is to establish a stable 3D coordinate framework, transfer geometry across a large scene, or control downstream scanner registration. Handheld scanners, scan arms, and TLS systems are usually stronger when the deliverable is dense surface geometry and local or scene-scale coverage matters more than coordinate transfer through a target network. [6] [9] [10] [12]
| System type | Best deliverable | Typical strength | Main limitation |
|---|---|---|---|
| Target-based photogrammetry | 3D coordinates / reference network | Large-volume coordinate control | Needs targets, scale, and strong network geometry |
| Handheld laser-line scanner | Dense local surface data | Fast close-range detail capture | Volumetric performance scales with part size |
| Scan arm | Controlled local inspection | Strong local accuracy inside arm reach | Limited working envelope |
| TLS | Scene-scale point clouds | Large-area coverage from fixed stations | Registration and distance effects dominate results |
| Hybrid | Global frame plus local surface detail | Combines coordinate control with dense capture | More planning and verification work |
First-pass taxonomy only; do not compare specs without matching metric/test basis.
Scope and terms (what we mean by industrial photogrammetry and laser scanner)
The main comparison here is industrial target-based photogrammetry versus three laser scanner families used in industrial measurement: handheld laser-line scanners, articulated arm plus laser line probe systems, and terrestrial laser scanners. Laser trackers appear only as adjacent large-volume coordinate-metrology reference systems and for standards-scope clarification; they are not treated as a scanner subclass in this article. [20]
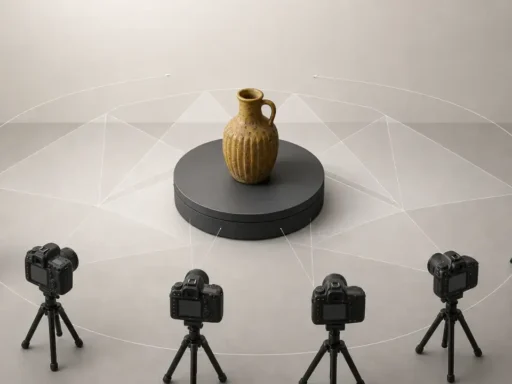
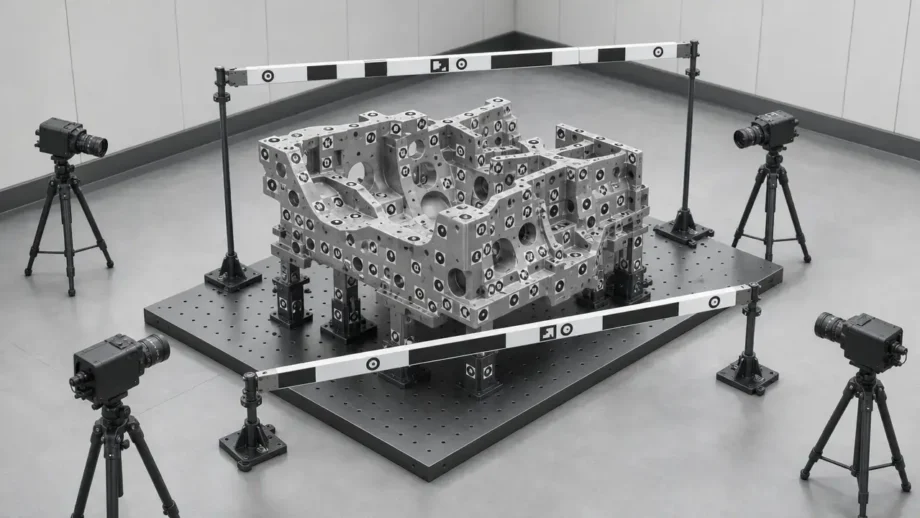
Industrial photogrammetry here means a target-based workflow that uses coded and uncoded targets, calibrated scale information, and bundle adjustment or bundle block adjustment to solve a 3D coordinate network. The deliverable is typically a coordinate report, a reference frame, or a verified set of points that other inspection steps can use. That is different from consumer or mesh-first image reconstruction, where the usual goal is a textured surface model rather than a traceable coordinate framework. ZEISS TRITOP is a clear example of the metrology version of this workflow: the software uses bundle block adjustment, and the output is 3D coordinates for each measuring point as a 3D point cloud. [6]
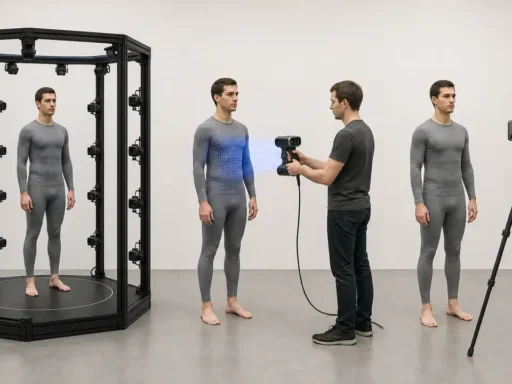
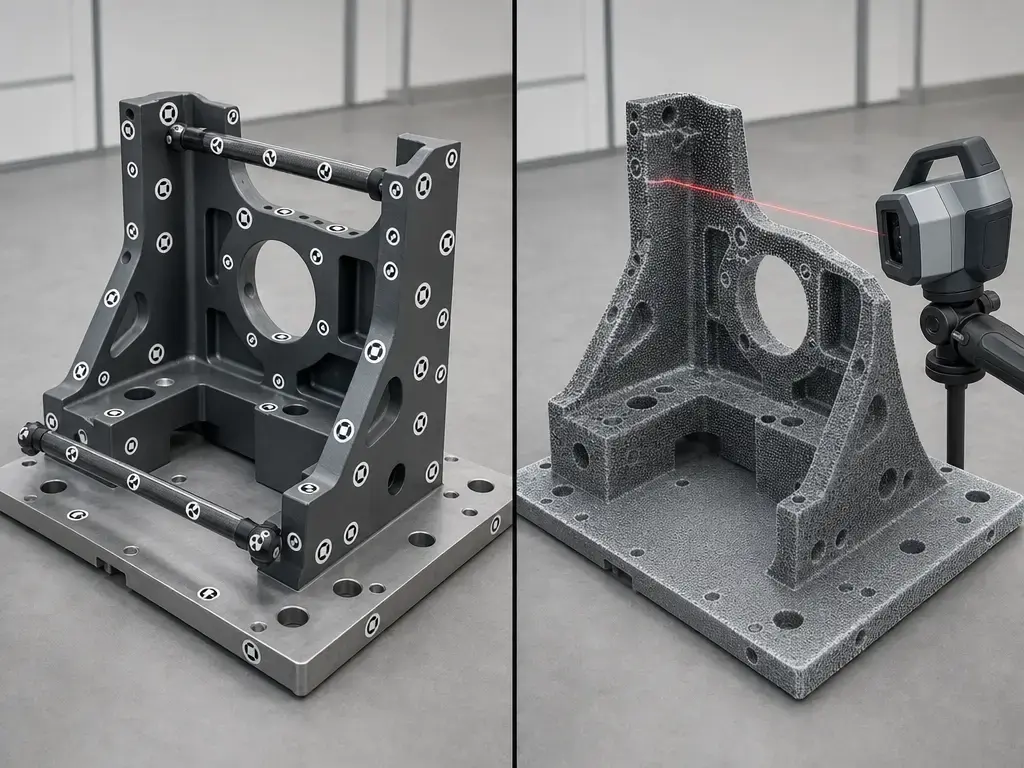
The laser scanner side is broader. Handheld laser-line scanners are close-range systems optimized for dense local surface capture. Scan arms combine an articulated arm with a probe or laser line head for controlled inspection inside a defined reach envelope. TLS systems capture large scenes from fixed stations and build a complete result through registration. All three can support industrial 3D measurement, but they do not produce the same deliverable by default. A coordinate network is not the same thing as a dense surface map, even when both are 3D. [9] [10] [12]
Do not compare these as one device class.
- Target photogrammetry — camera-based coordinate metrology using coded targets, uncoded targets, scale bars, and bundle adjustment. [6]
- Handheld laser-line scanner — dense close-range surface capture, often marker-assisted, with local accuracy and volumetric scaling figures. [9]
- Scan arm — articulated arm plus probe or laser line head for controlled local inspection inside the arm’s reach. [10] [11]
- TLS — fixed-station scene scanning with registration between setups and distance-dependent performance. [12]
- Laser tracker — adjacent reference system, not a scanner class in this article, with its own standards scope under ISO 10360-10. [20]
A short industrial history (why photogrammetry became a metrology tool)
Industrial close-range photogrammetry became practical as digital imaging, automation, calibration methods, and industrial verification expectations matured together. The key change was not just the move to digital cameras, but the integration of photogrammetry into measurement practice with defined accuracy targets, process integration, verification, and traceability expectations. By 2010, the industrial literature already described photogrammetry as covering discrete points, deformations, 6DOF measurement, contours, and 3D surfaces across both on-line and off-line systems, with verification and traceability treated as standard parts of industrial use. [22]
Technical principles: coordinate networks vs dense surface capture
Photogrammetry works as coordinate metrology first. Multiple images observe coded or uncoded targets from different viewpoints, and the system triangulates target centroids into a 3D network. Redundancy is part of the accuracy strategy: strong intersection angles, good image distribution, depth variation, and calibrated scale information help the network resist drift and expose weak geometry. In metrology-grade workflows, scale bars are not optional accessories. They constrain size, support verification, and connect the solved network to a usable measurement result. That is why industrial systems such as TRITOP emphasize bundle block adjustment and 3D coordinate output rather than a mesh-first pipeline. [6]
Laser scanning starts from surface capture. Handheld scanners and scan arms collect dense local point data from a moving sensor head, while TLS systems capture scenes from fixed stations using time-of-flight distance measurement and then register those stations into one frame. Registration exists because each station or sweep sees only part of the object or environment. Leica’s RTC360, for example, is specified with a TLS | range of 0.5 m to 130 m and a TLS | speed of up to 2,000,000 points per second, which makes its design intent clear: large-area surface capture, not target-network solving as the primary deliverable. [12]
Metrics and standards: how to compare without lying to yourself
Metrology vocabulary matters because scanner marketing language often blurs distinctions that standards keep separate. VIM is the right anchor for terms such as measurement accuracy, measurement precision, measurement uncertainty, and metrological traceability. NIST’s guidance makes the practical point explicit: traceability is a property of the measurement result, established through a documented unbroken chain of calibrations, with each step contributing to stated uncertainty. So “the device was calibrated” is not the same claim as “this inspection result is traceable.” Point density, resolution, or a visually clean point cloud also cannot substitute for uncertainty. A dense surface dataset can still be the less trustworthy measurement result if its calibration, geometry, or registration are weak. [1] [3]
The next trap is metric mismatch. A photogrammetry system may publish a length measurement accuracy | MPE formula, while the same system family also publishes point-based measurement accuracy | RMS and point-based measurement accuracy | 3 sigma figures. Hexagon’s DPA Industrial and DPA Professional literature is a good example: the published photogrammetry system | length measurement accuracy | MPE is 15 µm + 15 µm × Length_diagonal [m], while the published photogrammetry system | point-based measurement accuracy | RMS is 2 µm + 5 µm/m and the published photogrammetry system | point-based measurement accuracy | 3 sigma is 3 µm + 7 µm/m. Those statistics describe different things and are not interchangeable. On the TLS side, Leica’s RTC360 states that its accuracy figures are reported at 68% confidence according to JCGM 100:2008 (GUM) unless otherwise noted, which is again a different basis from MPE or RMS. [2] [7] [12]
Standards scope is narrower than many buying guides imply. VDI/VDE 2634 Part 1 is relevant to mobile, flexible optical 3D measuring systems with imaging heads working by triangulation, including photogrammetry. The VDI 2634 background literature also distinguishes point-wise systems from area-based surface systems and emphasizes error of length measurement as a key acceptance idea. ISO 10360-10 is for laser trackers, not for laser scanners in general, and ISO 10360-8 applies to Cartesian CMMs with optical distance sensors rather than serving as a universal scanner-accuracy standard. [4] [5] [20] [21]
Do not compare spec numbers directly unless all of these match
- metric type: length / point / surface. [7]
- confidence basis: MPE / RMS / 3σ / 68% confidence. [2] [7] [12]
- test artifact or geometry. [8] [16]
- distance or measurement volume. [7] [12]
- registration method. [11] [17]
- environmental conditions. [12] [16]
Industrial photogrammetry workflow (metrology-grade, target-based)
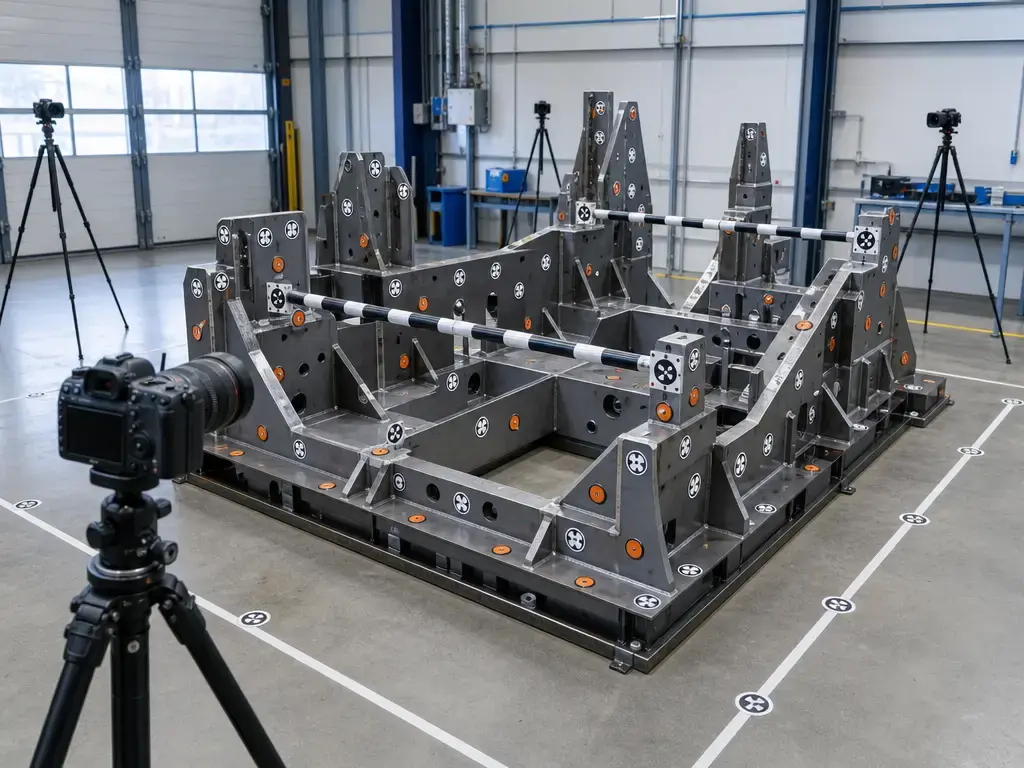
A metrology-grade photogrammetry job starts with the measurement plan, not the camera. The first questions are about datum strategy, target distribution, line of sight, depth variation, and where scale information will come from. If the deliverable is a global frame or long-span coordinate transfer, the target layout has to support that job explicitly. Random target placement is not enough. [6]
Capture quality depends more on redundancy and geometry than on the number of photos alone. Targets should be visible from multiple viewpoints, the image sequence should create strong overlap and intersection geometry, and scale should be distributed so that one well-seen local region does not masquerade as whole-volume control. ZEISS’s TRITOP documentation shows both sides of the metrology logic: the workflow uses bundle block adjustment, and each system is supplied with two DAkkS-calibrated linear scale bars that ensure the dimensional accuracy of the measured object coordinates. The same brochure also shows the hybrid role of the result, where reference coordinates captured first can be used by other sensors to achieve overarching accuracy over large areas. [6]
The output is usually a coordinate report and, when needed, a reference network that downstream scanning or inspection can use. That makes industrial photogrammetry especially useful when the first job is to establish the frame before the surfaces are filled in. [6]
- Plan the datum, coordinate frame, target density, and scale strategy for the object and surrounding structure. [6]
- Place coded targets, uncoded targets, scale bars, and any required adapters where they can be seen from multiple viewpoints. [6]
- Capture images in a sequence that preserves strong overlap, depth variation, and intersection geometry. [6]
- Run bundle adjustment or bundle block adjustment, then review network health, residuals, and outliers. [6]
- Export the coordinate report and reference coordinates needed for inspection, alignment, or transfer. [6]
- Optionally add a dense scan in the same frame if surface detail is also required. [6]
Laser scanning workflows (handheld, scan arm, TLS) — what they optimize for
Handheld laser-line scanners and scan arms optimize for dense local geometry, speed, and access. They are built to follow the part and collect enough surface detail for inspection maps, freeform reconstruction, or local dimensional checks. A handheld example makes the metric differences visible: Creaform publishes the handheld laser-line scanner | accuracy of the HandySCAN BLACK|Elite as 0.025 mm, its handheld laser-line scanner | volumetric accuracy as 0.020 mm + 0.040 mm/m, and its handheld laser-line scanner | recommended part size range as 0.05–4 m. A scan-arm example shows the reach dependence of that class: FARO publishes the scan arm + laser line probe | non-contact measurement MPE for a Quantum X.S with FAROBlu Max xR as 0.030 mm @ 2.0 m and 0.068 mm @ 4.0 m. FARO also states that the non-contact values are based on ISO 10360-8 Annex D methods, which is an important reminder that their test basis is not the same as VDI/VDE 2634 Part 1 photogrammetry acceptance. [9] [10] [11]
TLS workflows optimize for larger scenes and station-based accumulation. The scanner covers more space per setup, but registration and georeferencing strategy become central to the result. Leica publishes the TLS | 3D point accuracy of the RTC360 as 1.9 mm @ 10 m, 2.9 mm @ 20 m, and 5.3 mm @ 40 m, with a TLS | range of 0.5–130 m and a TLS | range accuracy of 1.0 mm + 10 ppm. Those are useful scene-capture figures, but they are not directly comparable to handheld or photogrammetry specifications. Registration statistics from vendor software are also not the same thing as the true registration or georeferencing error of the final dataset. [12] [17] [18]
Where industrial photogrammetry beats a laser scanner (defined win conditions)
Here, “photogrammetry beats a laser scanner” means the job is deliverable-first: sparse coordinates, reference frames, deformation points, or long-span control. The win is not about producing the densest point cloud. It is about more reliable volumetric control, less drift or accumulation, and sometimes lower total setup burden for a laser scanning workflow whose main output is dense surface geometry. [1] [3] [6]
Photogrammetry is strongest when the inspection problem is really a network problem. If the task is to control geometry over many meters, verified lengths and independent check distances often matter more than point density. That is why photogrammetry-class specifications are often length-scaled. Hexagon’s DPA Industrial and DPA Professional publish a photogrammetry system | length measurement accuracy MPE of 15 µm + 15 µm × Length_diagonal [m]. Independent literature shows both the capability and the spread behind that kind of claim. In a 2016 benchmark, a reference constellation spanning about 14.5 m had an average associated standard uncertainty of 12.4 µm; the tested photogrammetry system | estimated standard uncertainty for V-STARS inca3 was 43.1 µm, while a photogrammetry configuration | estimated standard uncertainty for Nikon D700/VMS reached 187 µm. In a 2017 industrial study on raw parts up to 15 m, the authors reported relative precision of 1/10,000 and an estimated spatial uncertainty of σ = 0.20 mm for the measured targets in the industrial cases. This is about volumetric control more than point density. [7] [13] [14]
The practical consequence is that hybrid architectures often start with photogrammetry and then add scanning. ZEISS explicitly describes the reference-coordinate concept: TRITOP captures the reference point cloud first, and other sensors use those reference points to transform local measurements and preserve overarching accuracy across a large area. Creaform publishes the same architectural idea from the other direction with a hybrid system | volumetric accuracy of 0.020 mm + 0.015 mm/m when HandySCAN is combined with MaxSHOT NEXT Elite. Those hybrid figures are useful only if they stay labeled as hybrid, not treated as if they were native scanner-only or photogrammetry-only numbers. [6] [8]
Photogrammetry is the stronger first choice when…
- the deliverable is target coordinates or a reference network, not a mesh. [6]
- the task is large-volume alignment or assembly control over many meters. [7] [14]
- independent check lengths and scale-bar control are part of the acceptance method. [6] [8]
- volumetric control matters more than dense point spacing. [7] [13]
- one stable frame must be transferred across several downstream measurements. [6]
- scan registration would add more uncertainty burden than value for the job. [17] [18]
- the result has to be traceable as a measurement result with stated uncertainty, not only visually complete as a surface dataset. [1] [3]
Where a laser scanner still wins (and why)
A laser scanner wins when dense surface geometry is the deliverable. That includes freeform or unmarked surfaces, reverse-engineering jobs, CAD reconstruction, broad deviation maps, and cases where describing shape matters more than transferring a sparse but stable coordinate framework. In those cases, the scanning classes are built for the right output. A handheld laser-line scanner | volumetric accuracy figure such as 0.020 mm + 0.040 mm/m on the HandySCAN BLACK|Elite describes a local-detail workflow that remains useful as part size grows, and a scan arm + laser line probe | non-contact measurement MPE such as 0.030 mm @ 2.0 m and 0.068 mm @ 4.0 m shows how arm-based systems support controlled local inspection inside a known envelope. [9] [10]
A hybrid workflow is often the best answer, but only if the verification plan is explicit. Photogrammetry can set the frame, and a scanner can fill the surface, yet the combined workflow helps only when the team decides in advance how frame accuracy, registration quality, and surface acceptance will be checked. Otherwise the result can look detailed and consistent without meeting the inspection requirement. [3] [6] [17]
Network geometry and registration: the hidden error budget (photogrammetry and scanning)
In photogrammetry, small residuals do not automatically mean a correct long-span result. Weak intersection angles, shallow depth variation, poor scale-bar distribution, or an effectively planar network can let a bundle adjustment converge while hiding scale or affine distortion. Fraser’s 2012 case study is a clear warning: a self-calibrating bundle adjustment reached RMSE = 0.05 pixels, yet the network implied 22 mm of affine distortion over 30 m from only 0.017 mm of principal-distance change, and the uncorrected cylinder length error was 89 mm. In the same example, scale-bar discrepancies that should have been around 0.15 mm based on estimated point accuracy actually ranged from 0.4 mm to 0.6 mm when all four bars were used, until the geometry and calibration issue was handled correctly. Residuals helped diagnose the model, but they were not the uncertainty budget. [16]
The same logic applies to scanning registration. Low target-fit residuals or neat cloud-to-cloud numbers are not substitutes for the true registration or georeferencing error of the final result. Fan and co-authors called out that problem directly for TLS, noting that registration-error evaluation had often been based on manufacturer software statistics rather than on the actual registration or georeferencing error. NIST’s 2024 stitching work reinforces the point from another angle: range error evaluation by stitching exists precisely because overlap strategy, stitching, and range behavior deserve dedicated analysis rather than blind trust in software summaries. Do not compare residuals or spec numbers unless metric type, confidence basis, artifact, distance or volume, registration method, and environmental conditions match. [17] [18]
Before trusting the result, verify…
- calibrated scale bars are present if the workflow is photogrammetry. [6]
- independent check lengths are documented. [8] [16]
- the datum strategy is explicit. [3]
- residuals are reviewed, but not treated as uncertainty by themselves. [16] [17]
- environmental conditions are recorded. [12] [15]
- uncertainty or MPE is reported together with the method and metric basis. [2] [7] [12]
Applications in large-volume inspection (deliverables-focused)
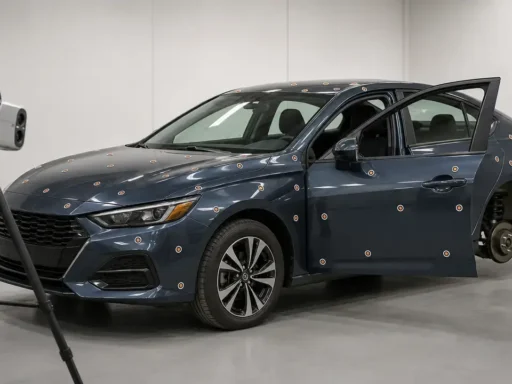
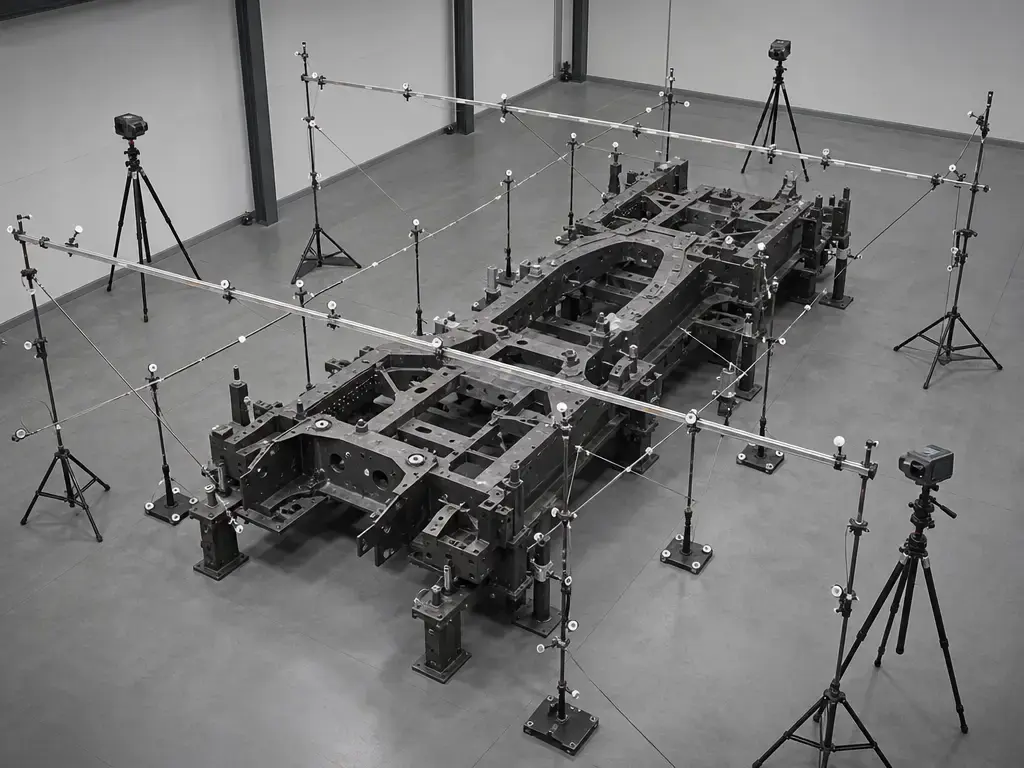
Large-volume inspection is where industrial photogrammetry and scanning most often share the same hardware environment while solving different metrology problems. In photogrammetry metrology, the deliverables are usually hole and adapter coordinates, datum transfer, deformation vectors, fixture alignment, or a coordinate frame that other sensors can reuse. The 2017 in-process study is a good example because it focuses on what the output was for: raw-part measurement and alignment before machining on parts up to 15 m long, not surface reconstruction for its own sake. That is the kind of job where global coordinate control becomes the primary task. [14]
In practice, the useful output is not a 3D model in the abstract. It is a measurement product that another decision depends on: an alignment transform, a bolt-circle check, a set of check lengths, a deformation history, or a scan-to-CAD comparison tied back to a verified frame. That is why photogrammetry often appears first in a large-scale metrology workflow and scanning second. The first establishes the measuring frame; the second adds local surface detail where the inspection needs it. [6] [14]
- Aircraft jig alignment — establish and verify fixture coordinates before assembly.
- Wind-turbine flange bolt pattern control — transfer a verified reference frame around a large circular interface.
- Ship-section measurement — control alignment and deformation across a large hull segment.
- Rail-car body inspection — compare body geometry against a registered datum set.
- Large casting or weldment setup — verify position before machining or dense scanning.
- Scanner station control — provide the reference network that multiple scan positions register into.
- Tooling and fixture transfer — move a stable coordinate frame between build, inspection, and rework steps.
- Deformation monitoring — track discrete points over time when change matters more than full-surface density.
Limitations and error sources (instrument uncertainty vs task uncertainty)
Instrument performance is not the same thing as task uncertainty. Instrument figures describe what a device or workflow can do under stated conditions and with a stated metric. Task uncertainty is what the project actually carries after part size, datum choice, thermal behavior, line of sight, operator choices, and acceptance rules are added. That second number is the real project risk. It is also why traceability belongs to the measurement result, not merely to the fact that one instrument in the chain was calibrated. [3]
Many important failure modes are practical rather than exotic. Thermal growth changes long-span geometry during capture. Vibration blurs images, weakens target centroiding, or reduces scan quality. Lighting can hurt target recognition in photogrammetry and degrade feature pickup in scanning. Reflectivity and occlusion reduce what the sensor can see. Target adhesion, datum movement, or poor adapter seating can shift the network after setup. Scale-bar handling matters because a misplaced, stressed, or badly distributed bar can corrupt the size constraint even when the images or scans look clean. Software can still report a good result while the setup is wrong. [3] [15]
A strong caution comes from the Strathclyde study on large-volume photogrammetry. The six-camera system covered 6.8 × 3.8 × 3.8 m, and the evaluated measurement volume was 3.9 × 3.05 × 2.3 m. The reported coordinate precision was less than 10 µm per axis, yet scale-factor correction was still needed; after applying that correction, the mean errors were 0.51 mm and 0.59 mm for the two datasets. High precision did not guarantee correct scale. [15]
How to choose between photogrammetry and laser scanning for large-scale metrology (decision matrix)
For photogrammetry vs laser scanner decisions, start with the deliverable and then test whether the uncertainty target, volume, density need, and verification burden fit the method. Use VIM language so the discussion stays about accuracy, uncertainty, and traceability rather than about whichever spec sheet has the most attractive single number. NIST’s traceability rule matters here too: the goal is not a calibrated device, but a measurement result that can be related to a reference through an unbroken chain with stated uncertainty. [1] [3]
Before committing, document five things: the deliverable, the uncertainty or tolerance target, the standards basis, the target or control plan, and the verification method. Example specifications show why the matrix has to stay type-aware. A photogrammetry system | length measurement accuracy MPE can scale with scene size, as in 15 µm + 15 µm × Length_diagonal [m] for Hexagon DPA Industrial/Professional, while a handheld laser-line scanner | accuracy and volumetric accuracy pair can mix a local figure and a size-scaled figure, as in 0.025 mm and 0.020 mm + 0.040 mm/m for HandySCAN BLACK|Elite. A TLS | 3D point accuracy figure is distance-dependent, as in Leica RTC360’s 1.9 mm @ 10 m, 2.9 mm @ 20 m, and 5.3 mm @ 40 m, and Leica reports those accuracy values at 68% confidence unless otherwise noted. None of those numbers answers the same question by itself. [7] [9] [12]
| Question | Choose photogrammetry if… | Choose laser scanner if… | Consider hybrid if… |
|---|---|---|---|
| What is the deliverable? | You need a traceable coordinate network, reference frame, or verified point set. | You need dense surface geometry, a mesh, or a deviation map. | You need both a stable frame and dense local surfaces. |
| Do you need a traceable length or coordinate network over many meters? | Yes; long-span coordinate control is the core task. | No; the task is mostly local or surface-based. | Yes, but dense surface detail is also required in selected areas. |
| Do you need dense surface geometry for CAD reconstruction? | Only if the coordinate network supports a later scanning step. | Yes; the surface itself is the product. | Yes, and the reconstructed geometry must stay tied to a verified global frame. |
| Will the workflow require multi-station registration? | You want to minimize stitching by establishing a reference network first. | You accept registration as a central part of the workflow. | Registration can be checked against photogrammetry control. |
| What does verification look like? | Check lengths, scale bars, and network geometry can be verified directly. | Surface data can be checked against CAD or an independent reference. | Separate acceptance checks exist for both frame and surface. |
| Which standards language best fits the result? | The acceptance rule is about coordinate accuracy, length error, and uncertainty. | The acceptance rule is about surface form, local deviation, or scanner-specific performance. | The project defines different criteria for frame control and surface capture. |
FAQ
When does photogrammetry beat a laser scanner in industrial metrology?
Photogrammetry wins when the deliverable is a coordinate network, a reference frame, or verified long-span coordinates rather than a dense mesh. In that situation, the key question is usually volumetric control across the whole scene, not local surface density. A good illustration is the photogrammetry system | length measurement accuracy MPE style used in some dedicated systems, such as 15 µm + 15 µm × Length_diagonal [m] for Hexagon DPA Industrial/Professional. That kind of metric is meant for size-scaled coordinate control, not for dense freeform capture. [7]
Photogrammetry vs laser scanner: what’s the real difference between volumetric accuracy and resolution?
Resolution describes detail density: how finely a surface is sampled or how small a feature can be separated in the delivered dataset. Volumetric accuracy describes how well coordinates or distances hold up across a measurement volume. Those are not the same thing. VIM separates accuracy, precision, and uncertainty for a reason, and traceability adds another layer because it belongs to the measurement result. A scanner can have excellent local detail but weaker whole-volume control, while a target network can be sparse yet still be the better metrology answer for long-span alignment or coordinate transfer. [1] [3]
Photogrammetry vs laser scanner for large scale metrology: which is “more accurate”?
It depends on what “accurate” is supposed to mean and how it is measured. A photogrammetry system | length MPE figure, a handheld scanner | volumetric accuracy figure, and a TLS | 3D point accuracy @ distance figure are not interchangeable. Hexagon’s DPA formula, HandySCAN’s 0.020 mm + 0.040 mm/m volumetric accuracy, and Leica RTC360’s 1.9 mm @ 10 m, 2.9 mm @ 20 m, and 5.3 mm @ 40 m answer different questions under different test bases and confidence conventions. The right comparison is always task-specific, not brand- or device-class-specific. [7] [9] [12]
How do scale bars affect traceability and uncertainty in industrial photogrammetry?
Scale bars do more than set size. They provide calibrated length information inside the network, help constrain the bundle solution, and support direct verification of whether the solved geometry is behaving as expected. ZEISS states that each TRITOP system is supplied with two DAkkS-calibrated linear scale bars that ensure the dimensional accuracy of the measured object coordinates, which is why scale cannot be replaced casually with a ruler value or an assumed CAD distance. They are part of the measurement chain behind the result, which is where traceability and uncertainty claims actually live. [3] [6]
Why can bundle-adjustment residuals (or registration residuals) look good while the result is wrong?
Because residuals describe how well the chosen model fits the observations, not whether the model, geometry, scale, and constraints were sufficient for the task. Fraser’s example reached RMSE = 0.05 pixels yet still implied 22 mm of affine distortion over 30 m and an 89 mm cylinder-length error before correction. TLS has the same problem in another form: Fan and co-authors warned that vendor software statistics are not competent measures of true registration or georeferencing error. Residuals matter, but they are not the whole error budget. [16] [17]
Laser tracker vs laser scanner vs photogrammetry: which is which, and when are they used together?
A laser tracker is an adjacent coordinate-metrology system with its own standards scope under ISO 10360-10; it is not the same class of device as a handheld scanner, scan arm, or TLS. ISO 10360-8, meanwhile, applies to Cartesian CMMs with optical distance sensors and sometimes appears in scanner-related vendor methods, but it is not a universal scanner standard. Photogrammetry fits best when you need a target-based coordinate network; scanners fit best when you need dense surface data. They are often used together, with photogrammetry or a tracker setting the frame and scanning filling in the surface. [20] [21] [6]
Sources
- JCGM 200:2012 (VIM) — International Vocabulary of Metrology (PDF)
- JCGM 100:2008 (GUM) — Guide to the Expression of Uncertainty in Measurement (PDF)
- NIST — Metrological Traceability (policy/FAQ page)
- VDI — VDI/VDE 2634 Blatt 1 listing (scope + issue date)
- ISPRS paper — Acceptance/verification test guideline background; Part 1 vs Part 2 split
- ZEISS — TRITOP Optical Photogrammetry System brochure (PDF)
- Hexagon MI — Photogrammetry inspection solutions / DPA Series brochure (PDF)
- Creaform — MaxSHOT technical specifications (web page)
- Creaform — HandySCAN 3D BLACK Series brochure (PDF)
- FARO — Quantum X Series brochure (PDF)
- FARO — Quantum Max product specifications (ISO 10360-8 Annex D basis statement)
- Leica Geosystems — RTC360 product specifications datasheet (PDF)
- UCL Discovery — Comparative Performance between Two Photogrammetric Systems and a Reference Laser Tracker Network for Large-Volume Industrial Measurement
- PMC — Self-Calibrated In-Process Photogrammetry for Large Raw Part Measurement and Alignment before Machining
- Strathprints — Spatial calibration of large-volume photogrammetry-based metrology (PDF)
- ASPRS proceedings PDF — Automatic camera calibration in close-range photogrammetry (Fraser, 2012)
- Lancaster EPrints (accepted manuscript PDF) — Error in target-based georeferencing and registration in terrestrial laser scanning
- NIST publication record — Laser tracker and terrestrial laser scanner range error evaluation by stitching
- Geodetic Systems — V-STARS D system page (accuracy + Hz)
- ISO — ISO 10360-10:2021 Laser trackers listing
- ISO — ISO 10360-8:2013 Optical distance sensors listing
- All3DP — LiDAR explainer (context only)
- Artec 3D — Photogrammetry vs 3D scanning (context only)
- ISPRS Journal (ScienceDirect page) — Close range photogrammetry for industrial applications (history/context)