
Summary: What aerial photogrammetry with drones does and does not do
Aerial photogrammetry is image-based measurement from overlapping aerial photographs: the art, science, and technology of obtaining reliable information from images. In drone work, that usually means turning a planned flight of photographs into deliverables such as orthomosaics, elevation products, point clouds, or meshes. [1]
Good-looking output is not the same as defensible measurement. Accuracy depends on flight planning, control, checkpoint testing, processing choices, and clear reporting of the coordinate reference system, units, and error statistics. A project can georeference successfully and still fail a survey or engineering tolerance if the control, geometry, or validation is weak. [10] [11] [13]
Quick definitions
A few terms cause most early confusion, especially when image products, elevation products, and accuracy terms get mixed together. USGS distinguishes an orthophoto from an orthomosaic: the first is a corrected aerial image, while the second is a larger mapped product assembled from many corrected images. The rest of the vocabulary matters just as much, because sampling scale, control, and validation are not interchangeable. [6] [7]
- Orthophoto: an aerial image corrected so displacement effects are removed. [6]
- Orthomosaic: a larger map-like image assembled from many orthophotos. [7]
- DSM / DTM / DEM: a DSM includes the visible surface, such as roofs, trees, and terrain; a DTM is intended to represent bare earth; DEM is ambiguous in practice, so qualify whether you mean a DSM-like raster, a DTM, or a software-specific product. [19]
- GSD / accuracy / precision: GSD is the nominal ground size represented by one pixel; accuracy is closeness to a reference value; precision is repeatability. GSD is not a guarantee of final map accuracy. [11] [16]
- GCP / checkpoint: GCPs constrain the solution during georeferencing; checkpoints are held out and used only to test positional accuracy independently. [10] [11]
- RTK / PPK: both improve camera-position observations, RTK in real time and PPK after the flight, but neither replaces independent validation. [17]
Historical background: from aerial photos to UAV photogrammetry
The lineage predates modern drones by a long way. Aerial photographs of Paris were being captured from a balloon in 1858, and early radio-controlled survey experiments followed much later, including a fixed-wing test in 1979 and model-helicopter work in 1980. What drones changed most was deployment convenience and operating flexibility, not the underlying photogrammetric requirement for overlapping images, control, and measurement. [18]
How drone photogrammetry works
Drone photogrammetry starts with overlapping images that share enough detail for software to detect keypoints, match them across photographs, and build tie points. Those matches establish the relative geometry of the image block. Absolute scale and georeferencing come later from control, direct georeferencing, or other known references, not from image overlap alone. [13] [14]
Bundle adjustment with self-calibration jointly optimizes camera poses and camera intrinsics, and weak image-network geometry makes the solution less robust, especially for scale and vertical accuracy. [13] [14]
The sparse or tie-point cloud is mainly an alignment product and a diagnostic for whether the block is behaving. Dense reconstruction estimates many more surface points from the aligned imagery. Final outputs then package that reconstruction into deliverables such as an orthomosaic, a DSM, a DTM, a point cloud export, or a mesh. These are related stages, but they are not the same thing. [14] [19]
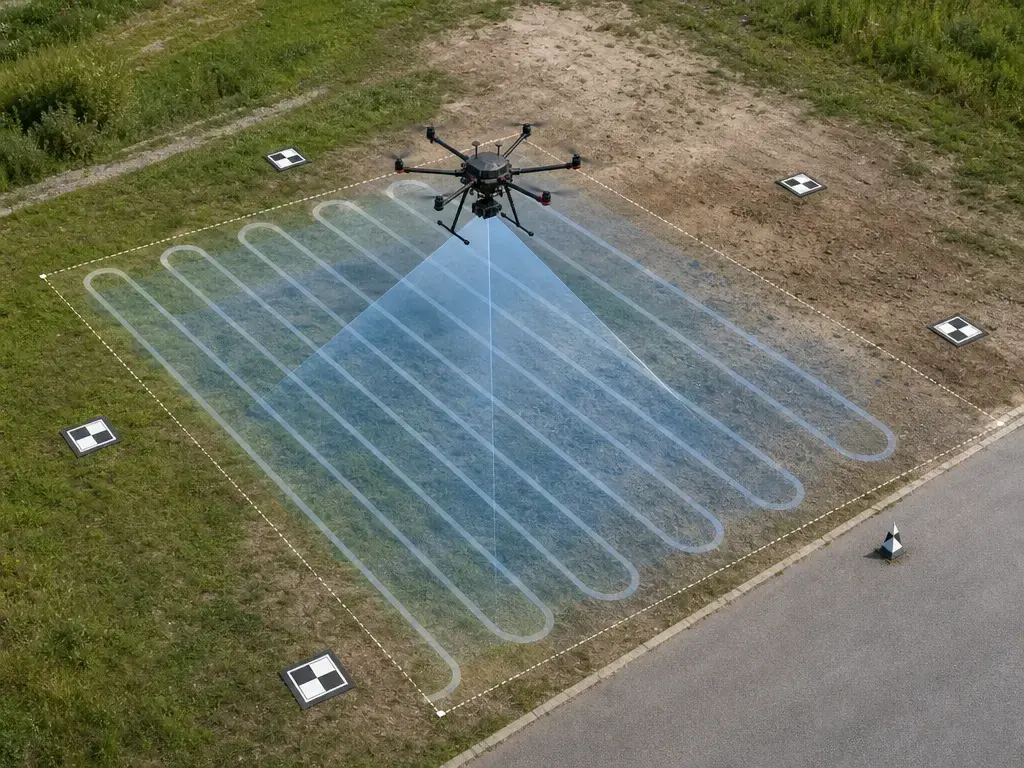
Core stages in a drone photogrammetry workflow
- Plan the area, altitude, overlap, and control strategy around the deliverable.
- Fly overlapping image strips with stable motion and consistent exposure.
- Georeference the block with GCPs and, if used, RTK or PPK camera tags.
- Detect features and match images into tie points.
- Run bundle adjustment and self-calibration.
- Check alignment quality and control distribution.
- Generate the dense point cloud.
- Derive the orthomosaic, DSM, DTM, or mesh as needed.
- Review residuals, gaps, and artifacts before delivery.
Accuracy control in aerial photogrammetry: standards, GCPs, checkpoints, RTK and PPK
Ground control points constrain the photogrammetric solution; checkpoints test it. That distinction matters because a low residual on a GCP only shows that the model was fit to that control point. It does not prove that the finished map is accurate everywhere else. ASPRS defines positional error against an independent higher-accuracy reference, and it notes that these computed differences are, strictly speaking, residuals, because the true coordinate can never be known exactly. [10] [11]
For practical positional-accuracy reporting, ASPRS Edition 2 Version 2 is the key checkpoint-based framework here. The standard overview calls for a minimum of 30 checkpoints for testing that meets ASPRS conditions, while also acknowledging that small drone projects may be unable to reach that count and must report that limitation accordingly. The same guidance distinguishes “tested to meet” from “produced to meet” language and says the report should include residuals at each checkpoint plus maximum, minimum, mean, median, standard deviation, and RMSE. [10]
If you cannot meet 30 checkpoints on a small drone site, say so explicitly. Do not claim a project was tested to meet ASPRS requirements unless the checkpoint count and reporting conditions were actually satisfied. [10]
ISO 19157-1:2023 serves a different role. It establishes principles for describing, evaluating, and reporting geographic data quality, but it does not define minimum acceptable quality levels. In practice, that means the standard helps structure the quality report, while the project specification or client requirement defines the pass-fail threshold. A separate draft, ISO/CD 17123-10.2, shows that field-test standardization for whole UAV photo-measurement workflows is still developing around known-coordinate markers used as GCPs and checkpoints. [2] [3]
RTK and PPK improve camera-position observations, which can reduce the amount of ground control needed and make block alignment more repeatable, especially when paired with good control design. They do not, by themselves, prove final map accuracy. If you want to make an accuracy claim about the delivered map or model, you still need independent checkpoints and clear reporting. For many mapping jobs, RTK or PPK is best understood as an input to the solution, not proof of the solution. [10] [17]
For cadastral, engineering, or stamped survey deliverables, licensed survey control and regulated workflows may be required depending on jurisdiction. Treat that as a boundary condition to verify before fieldwork, not after processing.
Planning a UAV photogrammetry mapping flight
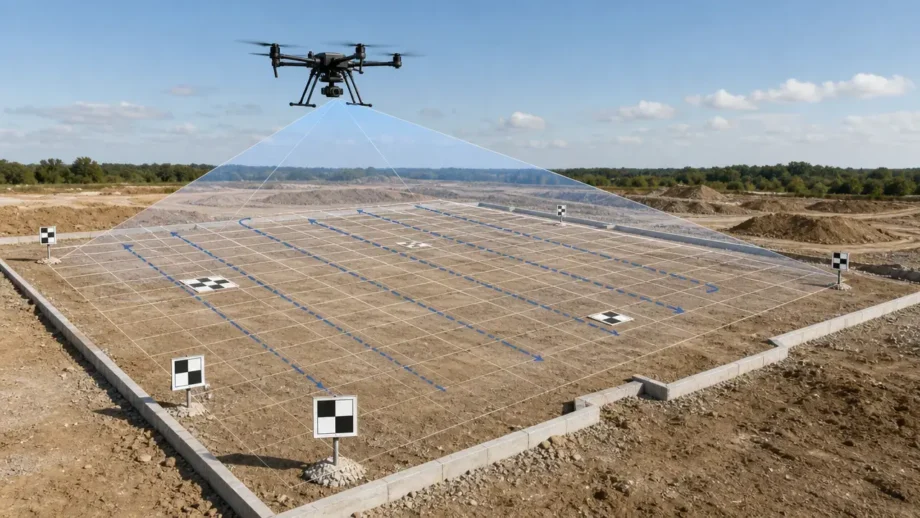
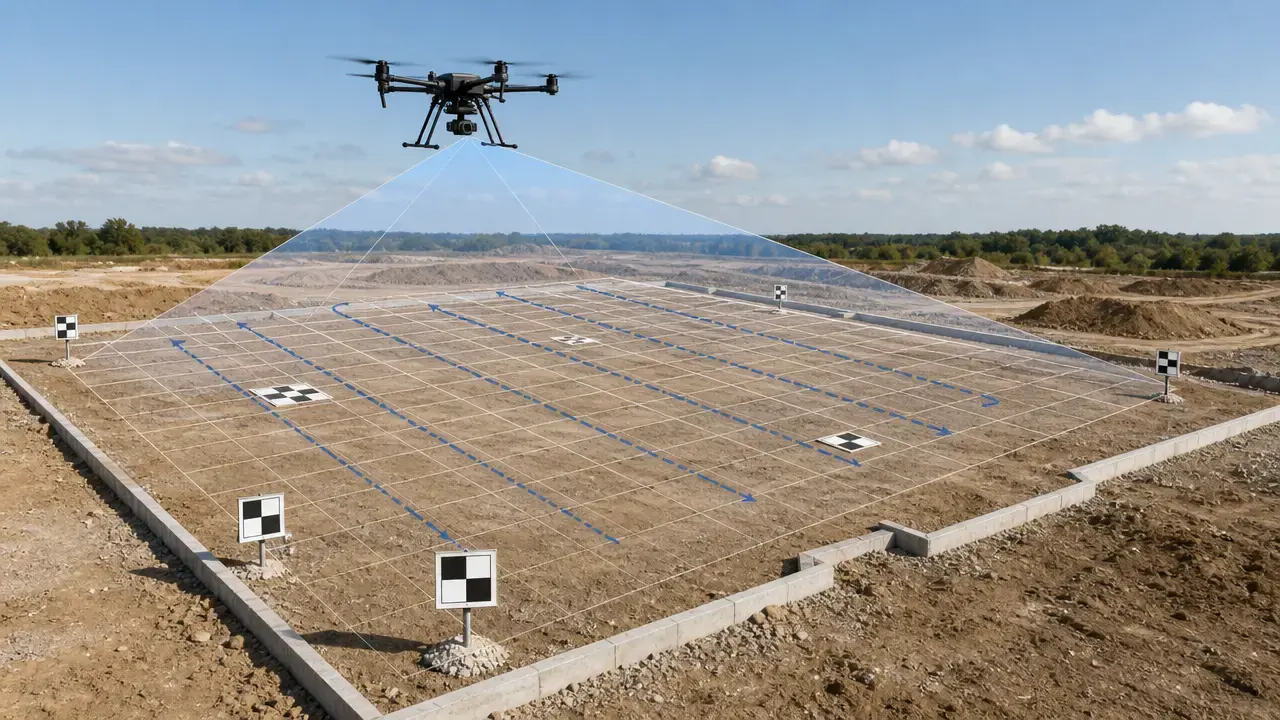
A good UAV photogrammetry mapping mission starts with the deliverable and required accuracy, then works backward through the area of interest, terrain relief, obstacles, sun angle, wind, desired GSD, overlap, speed, trigger interval, and battery segmentation. Vendor overlap numbers are useful guidance, not universal rules. Pix4D’s recommendations are explicitly for nadir imagery and commonly cluster around 75% frontal and 60% side overlap for general cases, with higher examples such as 80/80 for agriculture and 85/85 for forests. DJI Terra recommends 80% forward and 70% side overlap for most scenarios, with flat-area minimums of 65% forward and 60% side. Relief and tall features can reduce effective overlap even when the planned percentages look adequate on paper, so the plan has to fit the real surface, not a canned number. [8] [9]
For U.S. operations, FAA Part 107 highlights include drones under 55 lb total, minimum weather visibility of 3 miles, maximum altitude of 400 ft AGL unless the aircraft remains within 400 ft of a structure, and maximum speed of 100 mph (87 knots); check local rules elsewhere. [5]
Ground sample distance, overlap, and trigger interval
GSD is a sampling scale, not a contract for accuracy. It tells you how finely the ground is represented in the imagery, but it does not by itself certify the positional accuracy of the finished product. [11] [16]
Trigger timing links speed, image size, GSD, and overlap. Pix4D gives the frontal trigger-interval equation as t = ((imH × GSD)/100) × (1 − overlap) / v, and its worked example gives a 6 s interval at 75% overlap, 5 cm GSD, 4000 px image height, and 30 km/h flight speed. In practice, if you fly faster, ask for finer GSD, or demand more overlap, the camera has to fire more often. [16]
The tradeoff becomes obvious in a 1 ha simulation. At 80% overlap and 5 m/s, a 5 cm GSD mission took 3 min 18 s, required 90 images, and used about 4.52 GB. Pushing the same area to 1 cm GSD increased the mission to about 37 min, 2217 images, and 50.88 GB. Smaller GSD can quickly multiply flight time, storage, processing time, and quality-control workload, so the extra detail should be justified by the deliverable. [17]
Nadir vs oblique, grid vs corridor: choosing flight patterns that do not break geometry
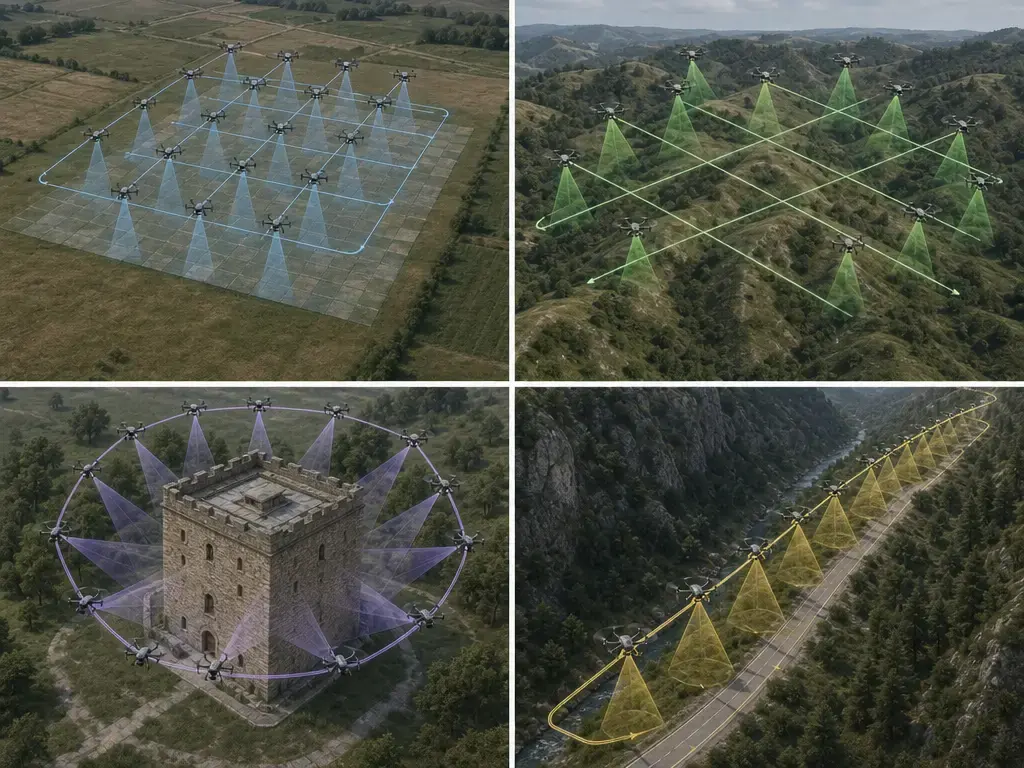
Nadir-only grids are efficient for orthomosaics and many terrain-oriented products, but they are often weak for façades, vertical assets, complex roofs, steep relief, corridor mapping, and higher-confidence 3D reconstruction. Those cases usually benefit from cross-strips, perimeter obliques, or both, because the image network gains more geometric diversity. Flight pattern choice is part of accuracy control, not just a coverage decision. [13] [15]
That geometry matters because self-calibration is only reliable when the block itself is strong enough. The University of Stuttgart specifically warns that corridor-like geometry may require pre-calibration. The 2025 rolling-shutter study likewise found better calibration and accuracy conditions when oblique imagery was included, and it showed that poor GCP layout can amplify errors. More images are not automatically better, but stronger geometry often is. [13] [15]
| Flight pattern | Best for | Main risk | Typical adjustment |
|---|---|---|---|
| Nadir grid | Orthomosaic/DSM | Weak vertical faces | Add obliques for 3D completeness |
| Cross-grid | Robust geometry | More images/time | Use for relief/high accuracy |
| Oblique / perimeter obliques | Buildings/industrial sites | Processing load | Control angle + overlap; watch exposure |
| Corridor | Roads/utilities | Weak block geometry | Increase overlap + add cross strips + control |
Processing workflow: from images to orthomosaic, DSM or DTM, point cloud, and mesh
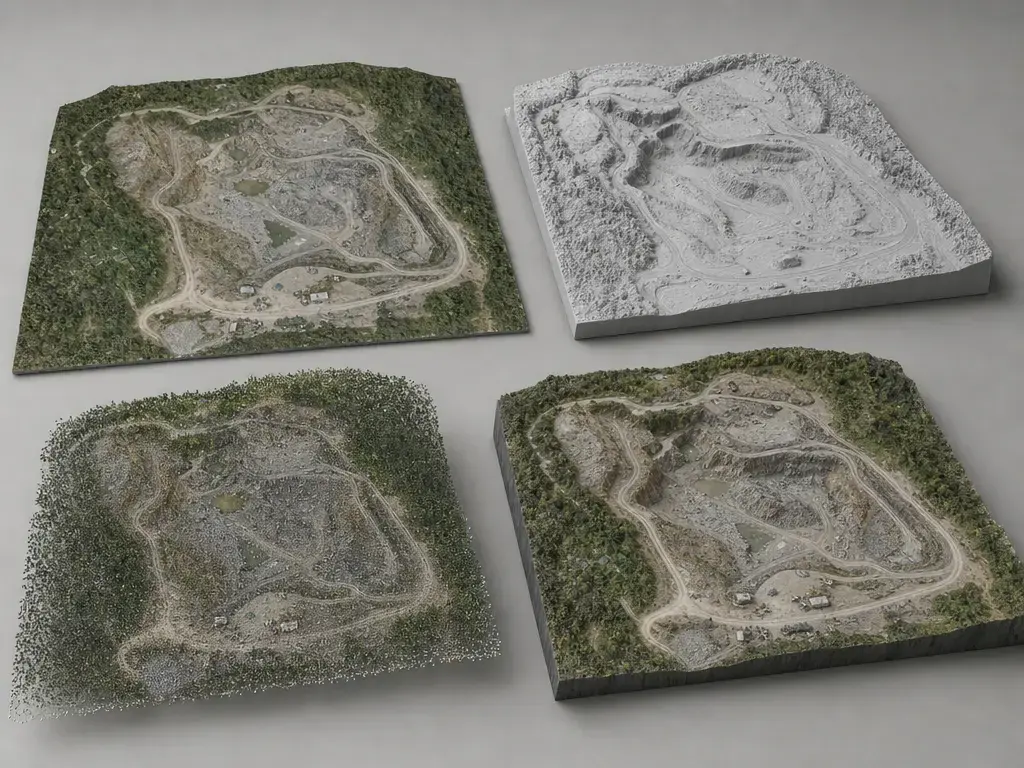
After capture and initial alignment, the software solves the image block by refining camera poses, lens parameters, and tie-point consistency. That stage is the quality hinge of the workflow: if overlap is weak, control is badly distributed, or self-calibration is unstable, the project may still render a surface but not one you should trust quantitatively. Dense reconstruction follows alignment and estimates many more surface points than the sparse stage. Those dense results are then turned into georeferenced deliverables. OpenDroneMap’s documentation gives a clear example of common outputs: point clouds in .ply, .laz, or .csv, textured meshes in .obj, orthophoto GeoTIFFs, and DSM or DTM GeoTIFFs. [14] [19]
Deliverables need precise naming and packaging. An orthomosaic, a DSM, a DTM, a point cloud, and a mesh answer different downstream needs, and “DEM” should not be left unqualified because different teams use it differently. The handoff should also specify the CRS, horizontal units, vertical datum, nominal GSD, and whether any DTM was actually derived as bare earth rather than simply exported from default software processing. Accuracy reporting belongs in the package separately from visual completeness. [10] [19]
Recommended handoff package
- Raw images.
- EXIF metadata.
- Flight log.
- GCP file.
- Checkpoint file.
- Coordinate reference system and vertical datum note.
- Processing report and settings.
- Orthomosaic GeoTIFF.
- DSM GeoTIFF.
- DTM, if produced, with method limits stated.
- Point cloud in LAS or LAZ.
- Mesh in OBJ or PLY, if relevant.
- Accuracy report wording, including checkpoint method, residual statistics, and tested-to-meet or produced-to-meet language as applicable. [10] [11]
Performance metrics: accuracy, precision, resolution, and completeness
Resolution, precision, and positional accuracy are not the same thing. Resolution is sampling scale, precision is repeatability, and positional accuracy is closeness to an independent higher-accuracy reference. [11]
For checkpoint reporting, separate horizontal and vertical results. ASPRS uses RMSEH for planimetric products, RMSEV for vertical products, and RMSE3D when three-dimensional positional accuracy is reported. ASPRS also notes that horizontal RMSE-based testing assumes near-normal errors, a sufficiently large sample, and a small mean error. Vertical reporting deserves separate treatment because vertical accuracy is often slightly worse than horizontal in UAV photogrammetry and is more sensitive to geometry, control, and land cover. A single generic accuracy number hides too much. [11] [12]
ASPRS further separates non-vegetated vertical accuracy from vegetated vertical accuracy because vegetated areas can produce skewed distributions and different error behavior. That is why RMSE alone is not enough. Checkpoint residuals should be reviewed point by point, and the report should also include maximum, minimum, mean, median, and standard deviation alongside RMSE. That fuller set of statistics is better at surfacing bias, outliers, and land-cover effects. [10] [11]
Completeness is a separate quality dimension: a block can post acceptable checkpoint statistics and still miss façades, canopy interiors, or occluded surfaces. Vendor “×GSD” rules of thumb can be useful planning expectations, but they are not standards and they are not proof of delivered accuracy. [11] [13] [15]
Limitations and failure modes
Aerial photogrammetry is sensitive to the surfaces it sees. Weak texture, reflective or transparent materials, repetitive patterns, water, snow, and scenes with moving vegetation or traffic can all reduce matching quality or produce holes and distortions. DJI’s guidance specifically flags weak-texture scenes such as water, glass, and large single-texture surfaces, as well as moving objects such as heavy traffic or vegetation in the wind, as problem cases for visible-light reconstruction. [9]
Motion blur and rolling shutter need conditional treatment, not blanket rules. Speed, exposure time, stabilization, and whether the software models rolling-shutter behavior all matter, and stronger geometry can help reduce the impact. [15]
Geometry failures are just as important as surface failures. Relief can reduce effective overlap at the highest parts of the site, corridor blocks can be weak, and poor control placement can destabilize self-calibration or amplify error. In practice, the fix is often not more processing, but better block design, better control distribution, and a flight pattern matched to the scene. [8] [13] [15]
Applications of aerial photogrammetry
Aerial photogrammetry is useful wherever a georeferenced 2.5D or 3D view supports decisions better than a single photograph. Construction teams use it for progress tracking, cut-and-fill review, and site documentation. Mining and quarry teams use it for surface change and stockpile workflows. Agriculture uses it for field mapping, and infrastructure teams use it for assets, corridors, and inspection support.
It is also valuable for disaster documentation, digital-twin inputs, and site recordkeeping, especially when the output needs to move into GIS, CAD, or BIM rather than remain a standalone image. Photogrammetry can complement other sensing methods, but it should not be treated as a universal substitute for LiDAR.
Current research and market context
Current research in UAV photogrammetry continues to focus on view planning, calibration robustness, automation, rolling-shutter modeling, and stronger quality assurance. Standardization activity reflects the same pressure for better workflow discipline: a domain-specific IEEE photogrammetric technical standard for civil light and small UAS in overhead transmission line engineering is active, while ISO/CD 17123-10.2 remains under development for field testing of UAV photo-measurement workflows. [3] [4] [14] [15]
The market itself is broader than any one ecosystem. Desktop tools, cloud processing, and open-source pipelines all exist, often with overlapping deliverable types. The practical question is not which brand is best in the abstract, but which workflow can document processing, preserve data lineage, and support the checkpoint-based accuracy reporting the project requires.
Practical takeaways for aerial photogrammetry projects
Aerial photogrammetry works best when the deliverable, geometry, control, processing, and reporting logic are defined before the aircraft takes off. If any one of those stays vague, the result may still look complete while failing to support a defensible measurement claim. The safest workflow is the one that defines what will be delivered, how the block will be controlled, how it will be tested with checkpoints, and how the CRS, units, and statistics will be reported at handoff. [10] [11] [13] [17]
- Define the deliverable and the required accuracy target.
- Plan the geometry around site conditions, GSD, overlap, and flight pattern, not a generic preset.
- Collect control with GCPs, checkpoints, and RTK or PPK as appropriate.
- Process with documented settings and a clear record of CRS and vertical datum choices.
- Test the finished product with independent checkpoints.
- Report the statistics, units, CRS, and accuracy statement clearly.
FAQ
What is aerial photogrammetry?
Aerial photogrammetry is image-based measurement from overlapping aerial photographs. In practical drone work, it usually means converting a flight of photos into mapped or 3D outputs such as orthomosaics, elevation products, point clouds, or meshes. The key idea is measurement, not just visual stitching. [1]
How does drone photogrammetry work?
Drone photogrammetry matches shared features across overlapping images, solves camera positions, and reconstructs the scene in 3D. Bundle adjustment and self-calibration refine the geometry, the sparse stage shows whether alignment is healthy, and dense reconstruction fills in the surface. Final outputs then package that reconstruction into map or model products. [13] [14] [19]
How do you plan a UAV photogrammetry mapping flight?
Start from the deliverable and accuracy requirement, then set the area of interest, terrain constraints, GSD, overlap, speed, trigger interval, and battery splits. Vendor overlap figures are guidance, not universal rules: Pix4D’s published figures are nadir-specific, while DJI Terra recommends higher overlap as a default range for many jobs. In the U.S., also check Part 107 limits. [5] [8] [9] [16]
Is RTK or PPK enough for aerial photogrammetry without GCPs?
Not by itself. RTK and PPK improve camera-position observations and can reduce the amount of ground control required, but they do not prove final product accuracy. If you need to make an accuracy claim about the delivered map or model, you still need independent checkpoints and clear reporting. [10] [17]
What overlap should I use for photogrammetry drone mapping?
There is no single universal overlap value. For nadir imagery, Pix4D commonly recommends 75% frontal and 60% side overlap in general cases, with higher examples for agriculture and forests. DJI Terra recommends 80% forward and 70% side for most scenarios, with 65% forward and 60% side as flat-area minimums. Relief, buildings, and trees can force you higher. [8] [9]
How should I report accuracy with checkpoints (RMSEH vs RMSEV, and what else besides RMSE)?
Report horizontal and vertical separately. ASPRS guidance supports RMSEH and RMSEV reporting, and if full 3D positional accuracy is reported, RMSE3D is separate again. RMSE alone is not enough: include residuals at each checkpoint plus minimum, maximum, mean, median, and standard deviation, and state whether the project was tested to meet or produced to meet the claimed class. [10] [11] [12]
When do I need oblique imagery or cross-strips instead of nadir-only mapping?
Use them when the block needs stronger geometry, such as for façades, complex roofs, steep relief, corridor surveys, or higher-confidence 3D work. Corridor-only geometry is especially fragile, and the 2025 rolling-shutter study found that oblique imagery improved calibration and accuracy conditions in the tested scenarios. [13] [15]
Sources
- NIST OSAC Lexicon: Photogrammetry definition. https://www.nist.gov/glossary-term/39701
- ISO 19157-1:2023: Geographic information — Data quality. https://www.iso.org/standard/78900.html
- ISO/CD 17123-10.2: Optics and photonics — Field procedures for testing geodetic and surveying instruments — Part 10-2. https://www.iso.org/standard/83171.html
- IEEE 1936.2-2023 lifecycle page. https://standards.ieee.org/ieee/1936.2/10521/
- FAA Part 107 highlights. https://www.faa.gov/newsroom/small-unmanned-aircraft-systems-uas-regulations-part-107
- USGS: Digital orthophotos. https://www.usgs.gov/publications/digital-orthophotos
- USGS Remote Sensing Coastal Change Glossary: Orthomosaics. https://www.usgs.gov/glossary/remote-sensing-coastal-change-glossary
- Pix4D overlap guidance for image acquisition. https://support.pix4d.com/hc/en-us/articles/203756125
- DJI Terra help: overlap recommendations and capture caveats. https://repair.dji.com/help/content?customId=01700004830&lang=en&paperDocType=ARTICLE&re=US&spaceId=17
- ASPRS PE&RS Public May 2025 issue: Ed.2 v2 overview. https://my.asprs.org/Common/Uploaded%20files/PERS/Full%20Issues/Public/PERS%20Public%202025-05.pdf
- ASPRS Positional Accuracy Standards Edition 2 Version 1. https://aagsmo.org/wp-content/uploads/2023/03/ASPRS_PosAcc_Edition2_MainBody.pdf
- MDPI IJGI 2021: Review on DTM accuracy assessment from UAV photogrammetry. https://www.mdpi.com/2220-9964/10/5/285
- University of Stuttgart: Low-cost UAV camera systems. https://www.ifp.uni-stuttgart.de/en/research/photogrammetric_systems/low-cost-uav-camera-systems/
- James et al.: Optimising UAV topographic surveys processed with SfM-MVS. https://discovery.ucl.ac.uk/id/eprint/10066677/
- Applied Sciences 2025 rolling shutter performance study repository copy. https://oa.upm.es/95129/
- Pix4D trigger interval equation. https://support.pix4d.com/hc/en-us/articles/202557479
- UGent Remote Sensing 2025 guideline PDF. https://backoffice.biblio.ugent.be/download/01JSMS012MP4GQE45YK1QG76KJ/01JSMS96P2B50051E5SCF28726
- Colomina and Molina 2014: UAS for photogrammetry and remote sensing review. https://www.ugpti.org/smartse/research/citations/downloads/Colomina-UAS_for_Photogrammetry_and_RS_Review-2014.pdf
- OpenDroneMap documentation: Outputs. https://docs.opendronemap.org/fil/outputs/