Summary
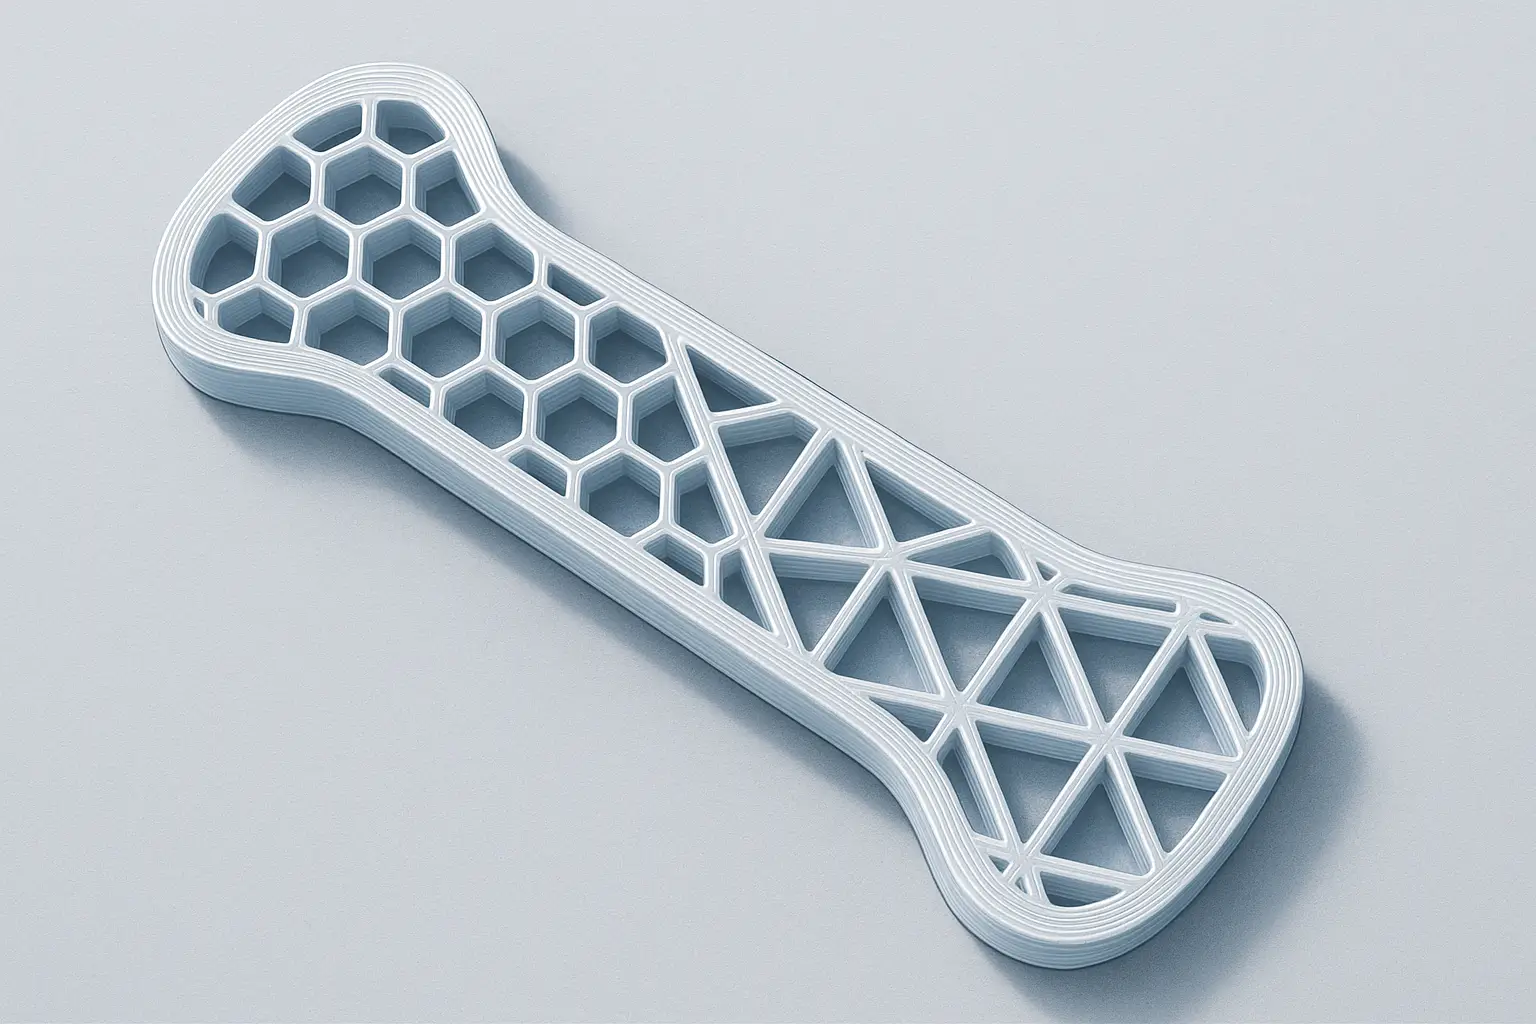
Infill percentage and pattern selection are instrumental factors in determining the strength, weight, and print duration of 3D-printed parts. Higher densities — particularly with hexagonal or honeycomb patterns — yield greater tensile and compressive strength, though increases diminish past 50 % infill. Combining patterns such as honeycomb and triangle further enhances mechanical durability. Z-axis weakness from anisotropy requires careful consideration. Standard slicer defaults — around 18–20 % infill — provide balanced, practical performance. [1][2][4]
Historical Background
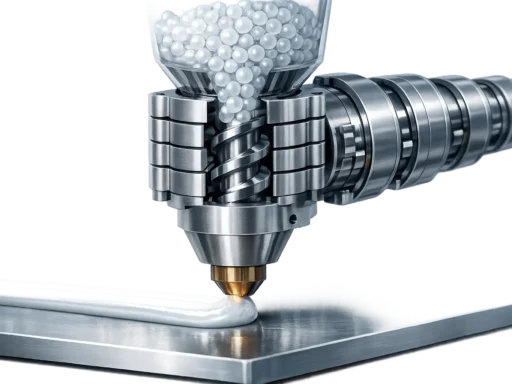
Fused Deposition Modeling (FDM), among the earliest and most widespread 3D printing technologies, popularized infill structures as a strategy for balancing strength, weight, and material costs. Originally, many early 3D prints by hobbyists using platforms like RepRap and MakerBot featured hollow shells or relied on simple concentric supports due to limited slicer capabilities — no reliable figure found for the specific year this practice was widespread. As printer software evolved, infill customization became standard, allowing users to select geometric patterns and densities to optimize mechanical properties and print efficiency. The evolution of infill practice mirrors the broader democratization of desktop 3D printing.
Technical Principles
Infill percentage is defined as the fraction of a print’s internal volume filled with material, while infill patterns describe the geometric arrangement of this internal structure. Typical infill densities range from 0 % (hollow) to 100 % (solid), with patterns designed for specific mechanical outcomes. [9]
Performance
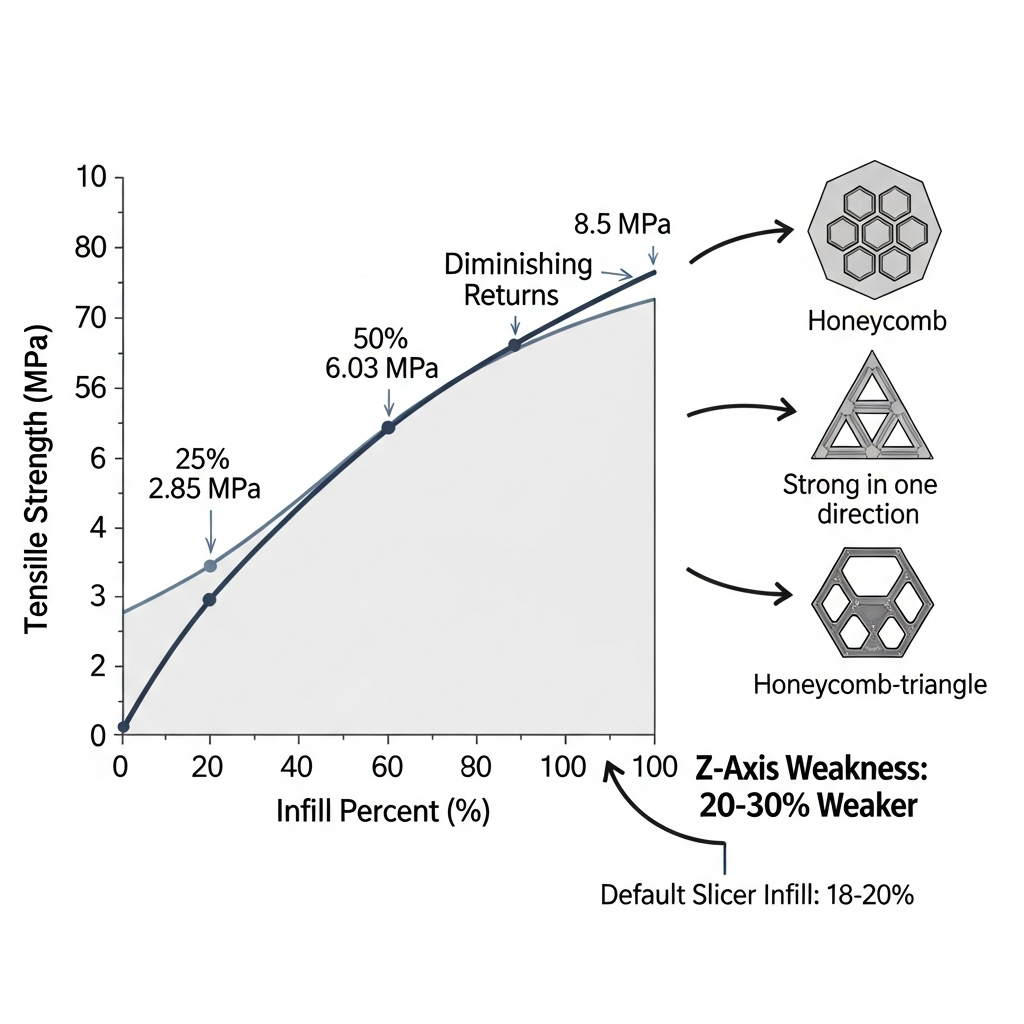
The mechanical strength of a 3D print is strongly influenced by both infill density and pattern. For example, PLA specimens printed with hexagonal infill demonstrate an increase in tensile strength from 2.85 MPa at 25 % infill to 6.03 MPa at 75 % infill — a roughly linear relationship.[1] Doubling the infill from 25 % to 50 % increases strength by around 25 %, while increasing from 50 % to 75 % yields only a 10 % gain, showing substantial diminishing returns at higher densities.[5] However, regardless of infill, most FDM prints remain 20–30 % weaker along the Z-axis, with approximately half the elongation compared to the XY axes, due to process-induced anisotropy.[6]
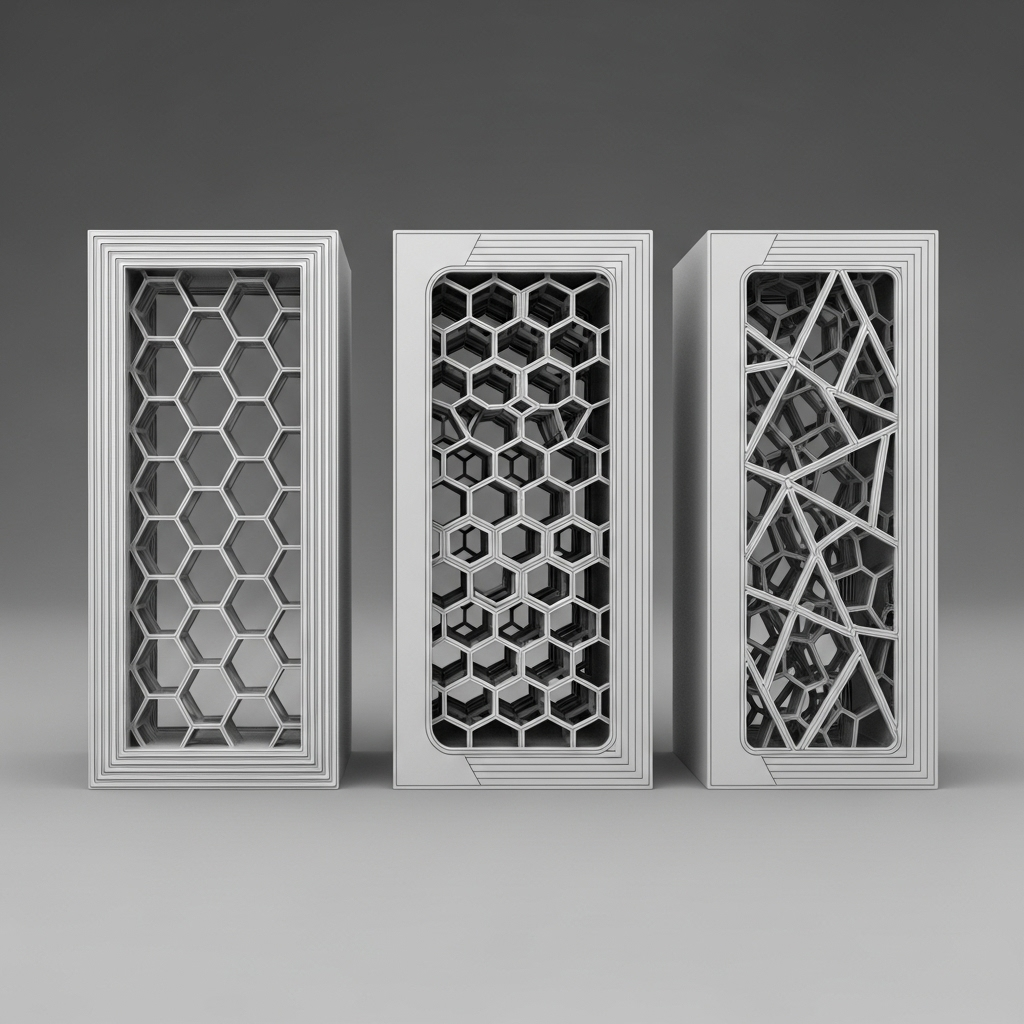
Compressive and impact properties also depend on infill pattern and density. At 60 % infill density, a grid structure in PLA achieves a compressive strength of 72 MPa, while a triangle infill produces a Young’s modulus of 0.68 GPa and impact resistance of 7.5 J.[3] Moreover, combining different patterns — such as honeycomb plus triangle at 50 % infill — can further improve both flexural and tensile strength as well as ductility, compared to using a single pattern.[7] Notably, strength gains above 80 % infill are minimal, emphasizing the efficiency of targeted combinations over simply increasing material usage.
Key Performance Observations
- Tensile strength rises linearly with infill up to 75 % in hexagonal patterns, but growth slows at high densities. [1]
- Increasing infill from 25 % to 50 % gives about 25 % more strength; 50 % to 75 % yields only 10 % more. [5]
- Compressive strength peaks around 72 MPa for grid patterns at 60 % infill; triangle patterns enhance modulus and impact resistance. [3]
- Anisotropy leads to 20–30 % less Z-axis strength. [6]
- Combining patterns (e.g., honeycomb + triangle) delivers optimal ductility and strength at moderate densities. [7]
Infill Pattern and Density Influences on Strength
| Infill Pattern | Infill % | Tensile Strength (MPa) | Compressive Strength (MPa) | Young’s Modulus (GPa) | Impact Resistance (J) |
|---|---|---|---|---|---|
| Hexagonal | 25 | 2.85 | — | — | — |
| Hexagonal | 75 | 6.03 | — | — | — |
| Grid | 60 | — | 72 | — | — |
| Triangle | — | — | — | 0.68 | 7.5 |
Applications
Selection of infill percentage and pattern is guided by required mechanical performance, weight reduction needs, and time/material constraints. Industry guidelines recommend the following ranges for different applications:
- 0–15 %: Decorative or non-structural prints.
- 15–50 %: Functional prototypes or lightly loaded parts.
- 50–100 %: Robust engineering components or parts requiring high durability. [8]
Within these ranges, patterns such as gyroid and cubic may be preferred for certain models due to their isotropic properties, though hexagonal or honeycomb are most consistently cited for general strength. The choice inherently involves trade-offs — high-density or complex infill patterns increase print time and material cost, whereas low-density infill sacrifices mechanical performance for efficiency.
Research Updates
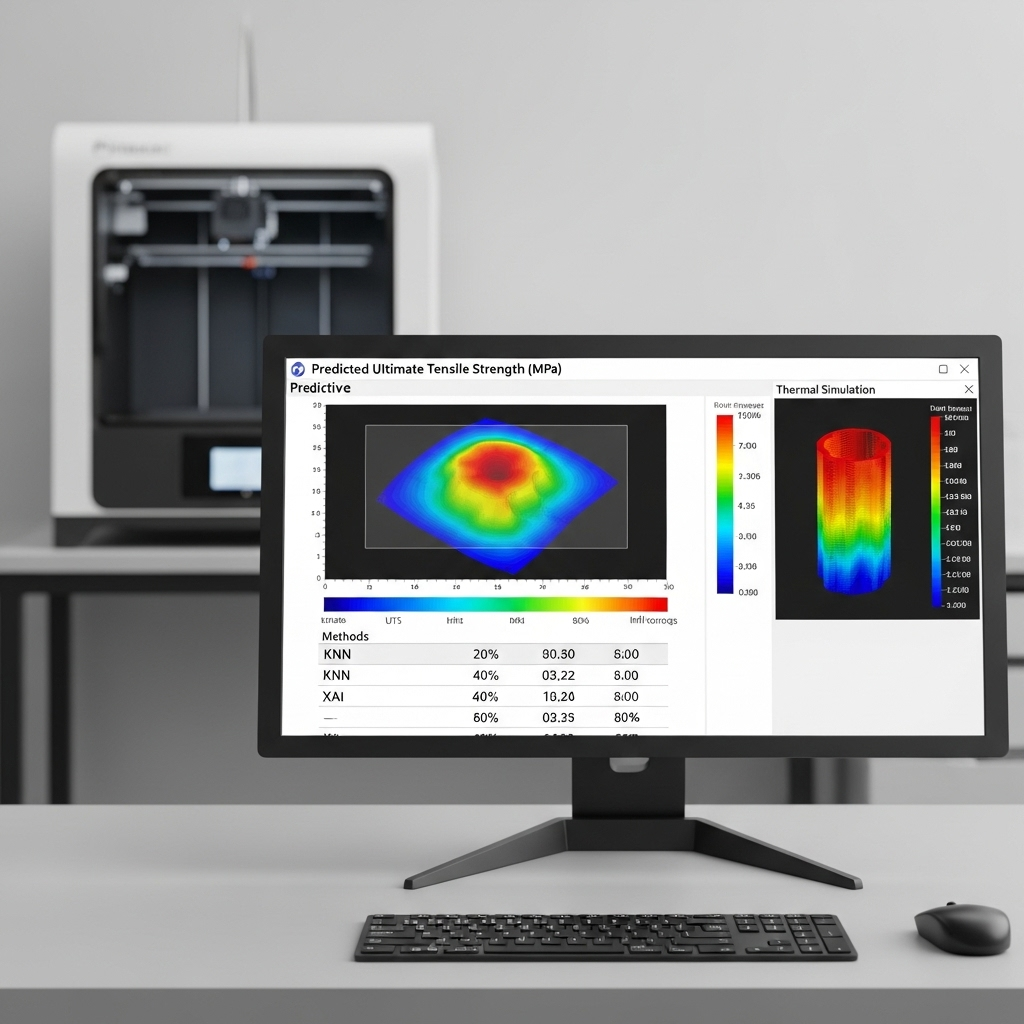
Recent research employs machine learning — including Explainable AI (XAI) and K-Nearest Neighbors (KNN) regression — to accurately predict ultimate tensile strength (UTS) based on infill parameters.[10] Thermal modeling and advanced geometric analyses of infill pattern orientation are further refining print optimization strategies, signaling a shift toward data-driven material science in additive manufacturing.
Frequently Asked Questions (FAQ)
What is the optimal infill percentage for maximizing print strength?
Print strength increases almost linearly up to 50 % infill; moving from 25 % to 50 % infill boosts strength by 25 %, but increases from 50 % to 75 % only add 10 %, reflecting diminishing returns above 50 %.[1][5]
How do infill patterns affect mechanical performance compared to infill percentage?
Infill pattern selection plays a critical role: hexagonal and honeycomb patterns consistently yield higher ultimate tensile strength than grid patterns at the same density, making them preferable for load-bearing applications.[2]
Can combining infill patterns improve strength or ductility?
Yes — combining patterns such as honeycomb with triangle at 50 % infill has demonstrated superior flexural and tensile strength as well as improved ductility, compared to using a single pattern, making this strategy advantageous for demanding prints.[7]
How much weaker are FDM prints along the Z-axis due to anisotropy?
Fused Deposition Modeling creates parts that are typically 20–30 % weaker along the Z-axis than in the XY plane, with about half the elongation, due to the layer-by-layer bonding process.[6]
Why do gains in tensile strength diminish beyond certain infill percentages?
Diminishing returns occur because the interior material provides less additional reinforcement as infill approaches 100 %; the most substantial strength increases occur when moving from low to moderate infill densities.[5]
What default infill settings are typical in slicers and why?
Most desktop FDM slicing software sets default infill to 18–20 %, balancing reasonable print strength, speed, and material efficiency for general-purpose printing.[4]
Sources
- Tensile strength comparison, MDPI: “Mechanical and Thermal Properties of PLA Specimens Printed with Various Infill Patterns and Densities” (See Table 3, page 6)
- Infill patterns comparison, MDPI: “Mechanical and Thermal Properties of PLA Specimens Printed with Various Infill Patterns and Densities” (Section 3.2, page 7)
- Compressive/impact properties, MDPI: “Influence of Infill Structure and Density on FDM Printed Pla Tensile, Compressive and Impact Properties”
- Default infill, Protolabs (Hubs): “Selecting Optimal Shell and Infill Parameters for FDM 3D Printing”
- Strength increases and diminishing returns, Protolabs (Hubs)
- Z-axis anisotropy in FDM, My3DMatter via 3DPrinterOS
- Combined pattern strength, IJERT: “Influence of Combining Different Infill Patterns”
- Recommended infill ranges, The 3D Printer Bee
- Infill pattern/percentage definitions, QIDI Tech US
- Machine learning for UTS prediction, arXiv:2305.18426